Bureau of Economic Analysis
Annual Update of GDP, Industry, and State Statistics Starts Sept. 25
Release of the annual update of gross domestic product and related statistics, including GDP by industry, begins Sept. 25. Updates of state and county statistics start Sept. 26.
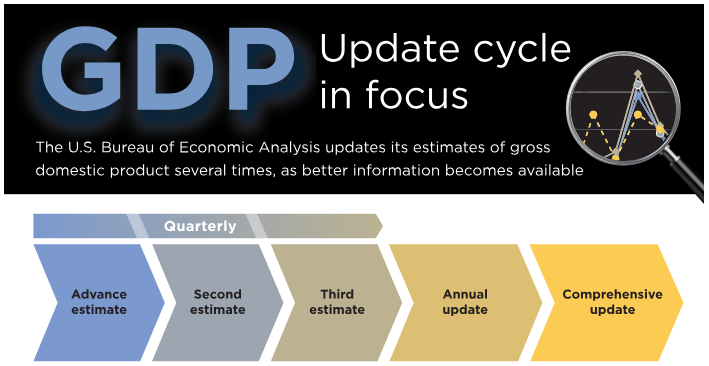
Regular annual updates enable the U.S. Bureau of Economic Analysis to refine our estimates as more complete source data become available. They are also a time to bring in improvements in methodology and presentation. This year, we'll introduce data on business investment in data centers.
Principal Federal Economic Indicators
Noteworthy
The Latest
Real Personal Income for Metropolitan Areas, 2017
The percent change in real metropolitan area personal income ranged from 14.8 percent in Midland, MI to -5.9 percent in Enid, OK.
Real Personal Income for States, 2017
The percent change in real state personal income ranged from 4.5 percent in New York to -1.3 percent in North Dakota.
Real Personal Income for States and Metropolitan Areas, 2017
Real state personal income grew 2.6 percent in 2017, after increasing 1.5 percent in 2016, according to estimates released today by the Bureau of Economic Analysis. Real state personal income is a state's current-dollar personal income adjusted by the state's regional price parity and the national personal consumption expenditures price index. The percent change in real state personal income ranged from 4.5 percent in New York to -1.3…
March 2019 Trade Gap is $50.0 Billion
The U.S. monthly international trade deficit increased in March 2019 according to the U.S. Bureau of Economic Analysis and the U.S. Census Bureau. The deficit increased from $49.3 billion in February (revised) to $50.0 billion in March, as imports increased more than exports. The previously published February deficit was $49.4 billion. The goods deficit increased $0.5 billion in March to $72.4 billion. The services…
U.S. International Trade in Goods and Services, March 2019
The U.S. monthly international trade deficit increased in March 2019 according to the U.S. Bureau of Economic Analysis and the U.S. Census Bureau. The deficit increased from $49.3 billion in February (revised) to $50.0 billion in March, as imports increased more than exports. The previously published February deficit was $49.4 billion. The goods deficit increased $0.5 billion in March to $72.4 billion. The services surplus decreased $0.2 billion…
Gross Domestic Product by State, Fourth Quarter 2018
Real gross domestic product (GDP) increased in 49 states and the District of Columbia in the fourth quarter of 2018. The percent change in real GDP in the fourth quarter ranged from 6.6 percent in Texas to 0.0 percent in Delaware. Wholesale trade, mining, and information services were the leading contributors to the increase in real GDP nationally. Mining and wholesale trade were the leading contributors to the …
Gross Domestic Product by State: Fourth Quarter and Annual 2018
Real gross domestic product (GDP) increased in 49 states and the District of Columbia in the fourth quarter of 2018. The percent change in real GDP in the fourth quarter ranged from 6.6 percent in Texas to 0.0 percent in Delaware.
Real Consumer Spending Rises In March
Personal income increased 0.1 percent in March after increasing 0.2 percent in February. Wages and salaries, the largest component of personal income, increased 0.4 percent in March after increasing 0.3 percent in February.
Personal Income and Outlays, March 2019
Personal income increased 0.1 percent in March after increasing 0.2 percent in February. Wages and salaries, the largest component of personal income, increased 0.4 percent in March after increasing 0.3 percent in February.
GDP Increases in First Quarter
Real gross domestic product increased 3.2 percent in the first quarter of 2019, according to the “advance” estimate released by the Bureau of Economic Analysis. In the fourth quarter of 2018, real GDP increased 2.2 percent.


