
News Release
Direct Investment by Country and Industry, 2018
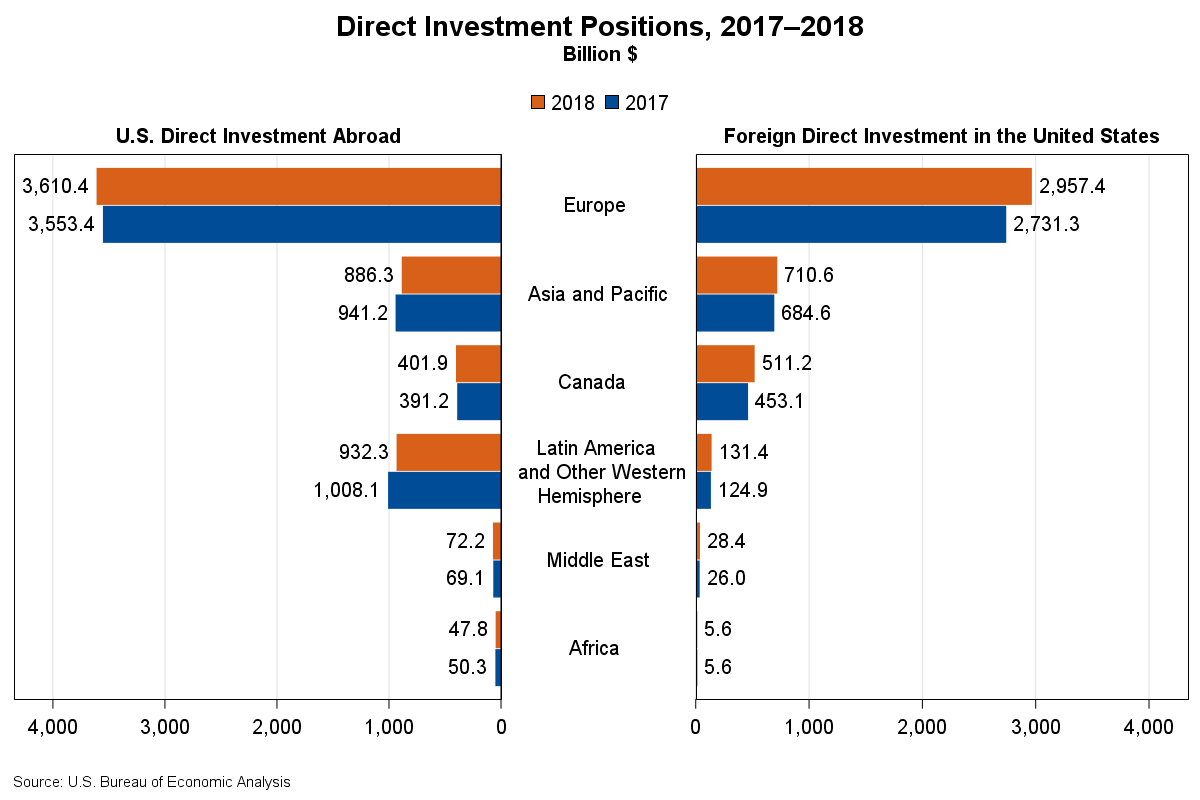
The U.S. direct investment abroad position, or cumulative level of investment, decreased $62.3 billion to $5.95 trillion at the end of 2018 from $6.01 trillion at the end of 2017, according to statistics released by the Bureau of Economic Analysis (BEA). The decrease was due to the repatriation of accumulated prior earnings by U.S. multinationals from their foreign affiliates, largely in response to the 2017 Tax Cuts and Jobs Act. The decrease reflected a $75.8 billion decrease in the position in Latin America and Other Western Hemisphere, primarily in Bermuda. By industry, holding company affiliates owned by U.S. manufacturers accounted for most of the decrease.
The foreign direct investment in the United States position increased $319.1 billion to $4.34 trillion at the end of 2018 from $4.03 trillion at the end of 2017. The increase mainly reflected a $226.1 billion increase in the position from Europe, primarily the Netherlands and Ireland. By industry, affiliates in manufacturing, retail trade, and real estate accounted for the largest increases.
Effects of the 2017 Tax Cuts and Jobs Act (TCJA) on U.S. Direct Investment Abroad
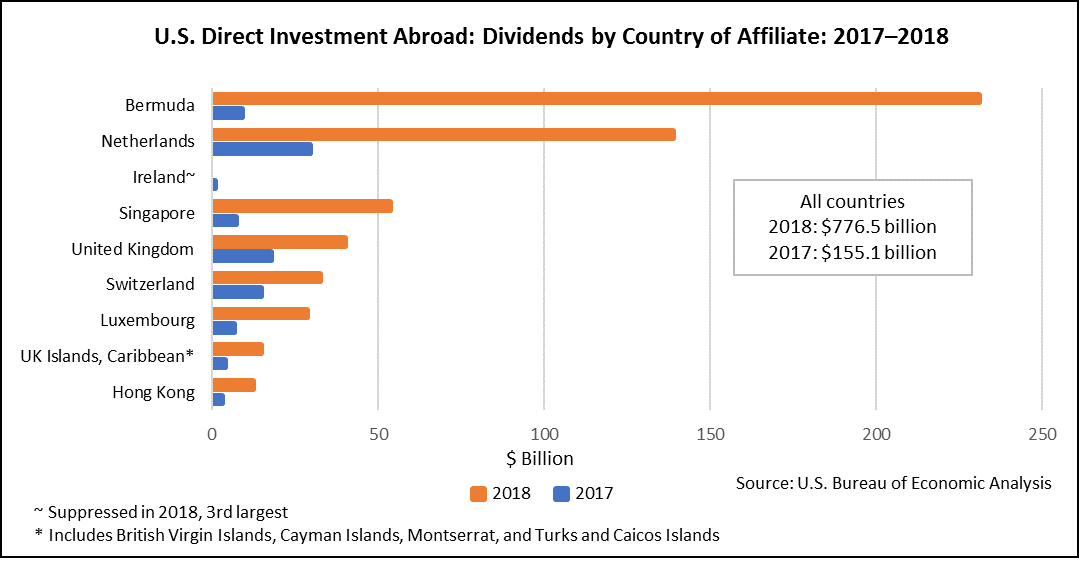
The TCJA generally eliminated taxes on dividends, or repatriated earnings, to U.S. multinationals from their foreign affiliates. Dividends of $776.5 billion in 2018 exceeded earnings for the year, which led to negative reinvestment of earnings, decreasing the investment position for the first time since 1982. Tables 3 and 4 provide information on the country and industry breakdown of dividends.
By country, nearly half of the dividends in 2018 were repatriated from affiliates in Bermuda ($231.0 billion) and the Netherlands ($138.8 billion). Ireland was the third largest source of dividends, but its value is suppressed due to confidentiality requirements. By industry, U.S. multinationals in chemical manufacturing ($209.1 billion) and computers and electronic products manufacturing ($195.9 billion) repatriated the most in 2018.
U.S. direct investment abroad (tables 1 – 6)
U.S. multinational enterprises (MNEs) invest in nearly every country, but their investment in affiliates in five countries accounted for more than half of the total position at the end of 2018. The U.S. direct investment abroad position remained the largest in the Netherlands at $883.2 billion, followed by the United Kingdom ($757.8 billion), Luxembourg ($713.8 billion), Ireland ($442.2 billion), and Canada ($401.9 billion).
By industry of the directly-owned foreign affiliate, investment was highly concentrated in holding companies, which accounted for nearly half of the overall position in 2018. Most holding company affiliates, which are owned by U.S. parents from a variety of industries, own other foreign affiliates that operate in a variety of industries. By industry of the U.S. parent, investment by manufacturing MNEs accounted for 54.0 percent of the position, followed by MNEs in finance and insurance (12.1 percent).
U.S. MNEs earned income of $531.0 billion in 2018 on their cumulative investment abroad, a 12.8 percent increase from 2017.
Foreign direct investment in the United States (tables 7 – 10)
By country of the foreign parent, five countries accounted for more than half of the total position at the end of 2018. The United Kingdom remained the top investing country with a position of $560.9 billion. Canada ($511.2 billion) moved up one position from 2017 to be the second largest investing country, moving Japan ($484.4 billion) into third, while the Netherlands ($479.0 billion) and Luxembourg ($356.0 billion) switched places as the fourth and fifth largest investing countries at the end of 2018.
By country of the ultimate beneficial owner (UBO), the top five countries in terms of position were the United Kingdom ($597.2 billion), Canada ($588.4 billion), Japan ($488.7 billion), Germany ($474.5 billion), and Ireland ($385.3 billion). On this basis, investment from the Netherlands and Luxembourg was much lower than by country of foreign parent, indicating that much of the investment from foreign parents in these countries was ultimately owned by investors in other countries.
Foreign direct investment in the United States was concentrated in the U.S. manufacturing sector, which accounted for 40.8 percent of the position. There was also sizable investment in finance and insurance (12.1 percent).
Foreign MNEs earned income of $208.1 billion in 2018 on their cumulative investment in the United States, a 19.7 percent increase from 2017.
Updates to Direct Investment Statistics Delayed
Updates to BEA’s detailed country and industry statistics for U.S. direct investment abroad and for foreign direct investment in the United States for 2016 and 2017 were delayed due to the impact of the partial federal government shutdown that started in late December 2018. BEA will update the 2016 and 2017 statistics in 2020 along with updates to the 2018 statistics."
Next release: July 2020
Direct Investment by Country and Industry, 2019