
Bureau of Economic Analysis
U.S. International Transactions, 3rd Quarter 2025
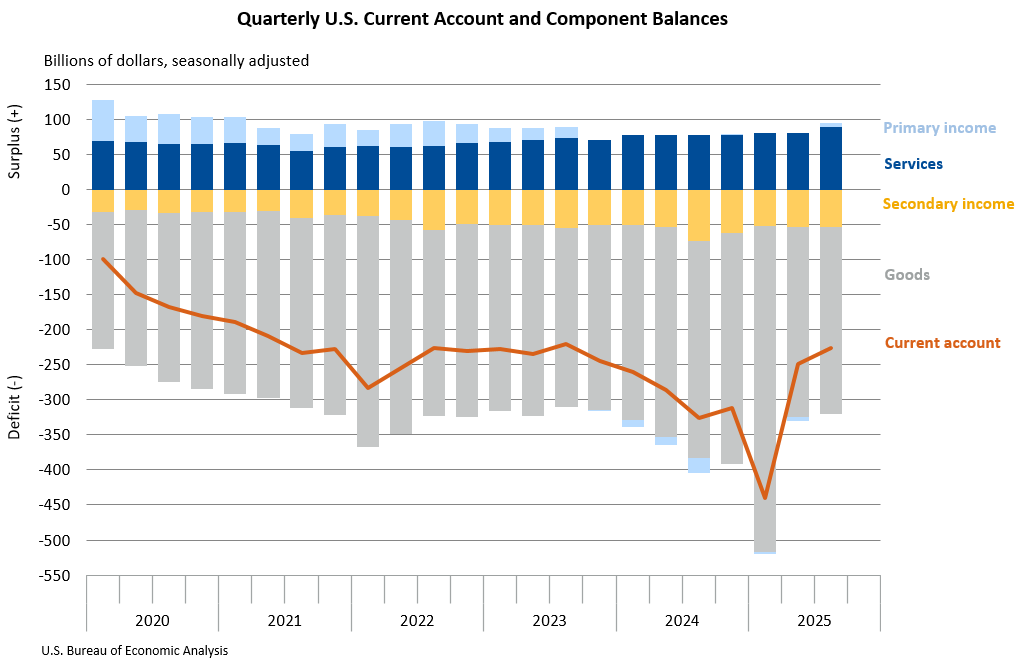
The U.S. current-account deficit narrowed by $22.8 billion, or 9.2 percent, to $226.4 billion in the third quarter of 2025, according to statistics released today by BEA. The revised second-quarter deficit was $249.2 billion. The third-quarter deficit was 2.9 percent of current-dollar gross domestic product, down from 3.3 percent in the second quarter.
Principal Federal Economic Indicators
Noteworthy


The Latest
Gross Domestic Product, 4th quarter and annual 2016 (third estimate); Corporate Profits, 4th quarter and annual 2016
Real gross domestic product (GDP) increased at an annual rate of 2.1 percent in the fourth quarter of 2016 (table 1), according to the "third" estimate released by the Bureau of Economic Analysis. In the third quarter of 2016, real GDP increased 3.5 percent. The GDP estimate released today is based on more complete source data than were available for the "second" estimate issued last month.
U.S. Net International Investment Position Fourth Quarter 2016
The U.S. net international investment position decreased to −$8,109.7 billion (preliminary) at the end of the fourth quarter of 2016 from −$7,807.3 billion (revised) at the end of the third quarter.
U.S. International Investment Position, 4th quarter and year 2016
Fourth Quarter 2016
The U.S. net international investment position decreased to -$8,109.7 billion (preliminary) at the end of the fourth quarter of 2016 from -$7,807.3 billion (revised) at the end of the third quarter, according to statistics released today by the Bureau of Economic Analysis (BEA). The $302.3 billion decrease reflected a $954.8 billion decrease in U.S. assets and a $652.5 billion decrease in U.S. liabilities…
State Personal Income, 2016
State personal income grew on average 3.6 percent in 2016, after increasing 4.5 percent in 2015. Growth of state personal income—the sum of net earnings by place of residence, property income, and personal current transfer receipts—ranged from –1.7 percent in Wyoming to 5.9 percent in Nevada.
State Quarterly Personal Income, 4th quarter 2016; State Annual Personal Income, 2016 (preliminary estimates)
State personal income grew on average 3.6 percent in 2016, after increasing 4.5 percent in 2015, according to estimates released today by the Bureau of Economic Analysis. Growth of state personal income—the sum of net earnings by place of residence, property income, and personal current transfer receipts—ranged from –1.7 percent in Wyoming to 5.9 percent in Nevada (table 1).
U.S. Current-Account Deficit Decreases in Fourth Quarter 2016
The U.S. current-account deficit decreased to $112.4 billion (preliminary) in the fourth quarter of 2016 from $116.0 billion (revised) in the third quarter of 2016. As a percentage of U.S. GDP, the deficit decreased to 2.4 percent from 2.5 percent. The previously published current-account deficit for the third quarter was $113.0 billion.
U.S. International Transactions, 4th quarter and Year 2016
The U.S. current-account deficit decreased to $112.4 billion (preliminary) in the fourth quarter of 2016 from $116.0 billion (revised) in the third quarter of 2016, according to statistics released by the Bureau of Economic Analysis (BEA). The deficit decreased to 2.4 percent of current-dollar gross domestic product (GDP) from 2.5 percent in the third quarter.
Travel and Tourism Satellite Account: Fourth Quarter 2016
Real spending (output) on travel and tourism turned down in the fourth quarter of 2016, decreasing at an annual rate of 3.3 percent after increasing 3.7 percent (revised) in the third quarter according to new statistics released by the Bureau of Economic Analysis.
Travel and Tourism Satellite Accounts, 4th quarter 2016
Real spending (output) on travel and tourism turned down in the fourth quarter of 2016, decreasing at an annual rate of 3.3 percent after increasing 3.7 percent (revised) in the third quarter according to new statistics released by the Bureau of Economic Analysis. In contrast, real gross domestic product (GDP) increased 1.9 percent in the fourth quarter after increasing 3.5 percent in the third. For the year, travel and tourism grew 2.3…
October 2015
Upcoming in the Survey of Current Business Direct Investment
Statistics on investment positions, international transactions, and the composition of investments of U.S. and foreign multinational enterprises.
Gross Domestic Product by StateQuarterly statistics for the first quarter of 2015 and 2006–2014 that show economic growth across states.