
Bureau of Economic Analysis
U.S. International Investment Position, 3rd Quarter 2025
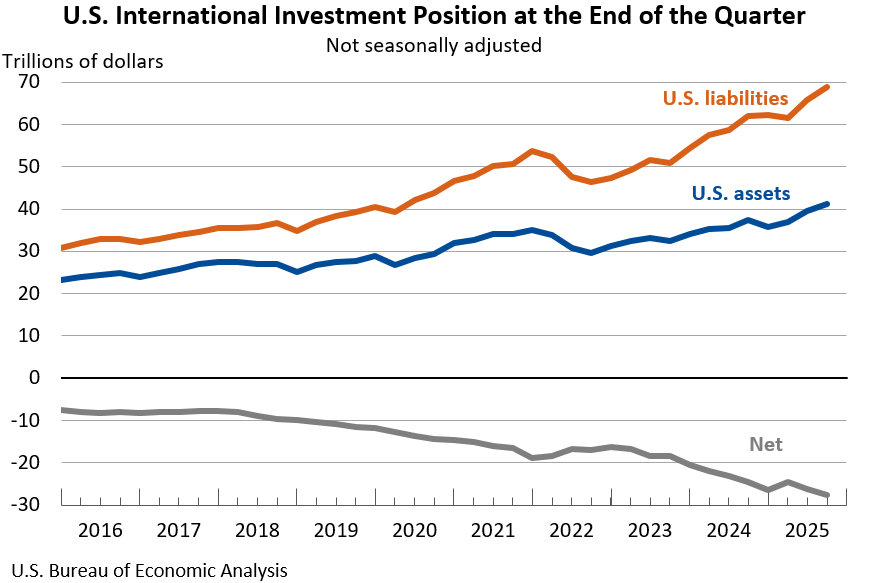
The U.S. net international investment position, the difference between U.S. residents’ foreign financial assets and liabilities, was -$27.61 trillion at the end of the third quarter of 2025, according to statistics released today by the U.S. Bureau of Economic Analysis. Assets totaled $41.27 trillion, and liabilities were $68.89 trillion. At the end of the second quarter, the net investment position was -$26.16 trillion (revised).
Principal Federal Economic Indicators
Noteworthy


The Latest
Gross Domestic Product, 4th quarter 2011 and annual 2011 (second estimate)
Real gross domestic product -- the output of goods and services produced by labor and property located in the United States -- increased at an annual rate of 3.0 percent in the fourth quarter of 2011 (that is, from the third quarter to the fourth quarter), according to the "second" estimate released by the Bureau of Economic Analysis. In the third quarter, real GDP increased 1.8 percent. The GDP estimate released today is based on more…
Personal Income and Outlays, December 2011
Personal income increased $61.3 billion, or 0.5 percent, and disposable personal income (DPI) increased $47.1 billion, or 0.4 percent, in December, according to the Bureau of Economic Analysis. Personal consumption expenditures (PCE) decreased $2.0 billion, or less than 0.1 percent.
Gross Domestic Product, 4th quarter and Annual 2011 (advance estimate)
Real gross domestic product -- the output of goods and services produced by labor and property located in the United States -- increased at an annual rate of 2.8 percent in the fourth quarter of 2011 (that is, from the third quarter to the fourth quarter), according to the "advance" estimate released by the Bureau of Economic Analysis.
Personal Income and Outlays, November 2011
Personal income increased $8.5 billion, or 0.1 percent, and disposable personal income (DPI) decreased $5.0 billion, or less than 0.1 percent, in November, according to the Bureau of Economic Analysis.
Gross Domestic Product, 3rd quarter 2011 (third estimate); Corporate Profits, 3rd quarter 2011 (revised estimate)
Real gross domestic product -- the output of goods and services produced by labor and property located in the United States -- increased at an annual rate of 1.8 percent in the third quarter of 2011 (that is, from the second quarter to the third quarter), according to the "third" estimate released by the Bureau of Economic Analysis. In the second quarter, real GDP increased 1.3 percent. The GDP estimate released today is based on more…
Travel and Tourism Satellite Accounts, 3rd quarter 2011
Real spending on travel and tourism decreased at an annual rate of 1.0 percent in the third quarter of 2011 after increasing 3.2 percent (revised) in the second quarter. By comparison, growth in real gross domestic product (GDP) increased 2.0 percent (second estimate) in the third quarter after increasing 1.3 percent in the second quarter. The decrease in real spending on tourism primarily reflected decreases in total transportation and in…
State Quarterly Personal Income, 1st quarter 2010-3rd quarter 2011
WASHINGTON DC, December 19, 2011 - State personal income growth slowed to 0.1 percent, on average, in the third quarter of 2011, according to estimates released today by the U.S. Bureau of Economic Analysis. Growth rates ranged from -0.4 percent in West Virginia to 0.6 percent in Washington State. Personal income fell or was unchanged in twenty states and grew 0.2 percent in the other thirty.
U.S. International Transactions, Third Quarter 2011
U.S. International Transactions: Third Quarter 2011 Current Account