
Bureau of Economic Analysis
U.S. International Investment Position, 3rd Quarter 2025
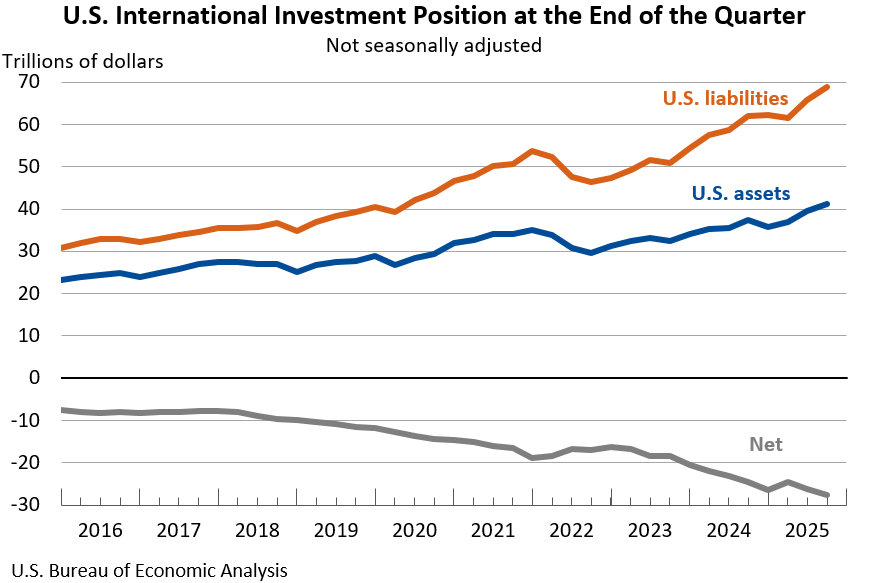
The U.S. net international investment position, the difference between U.S. residents’ foreign financial assets and liabilities, was -$27.61 trillion at the end of the third quarter of 2025, according to statistics released today by the U.S. Bureau of Economic Analysis. Assets totaled $41.27 trillion, and liabilities were $68.89 trillion. At the end of the second quarter, the net investment position was -$26.16 trillion (revised).
Principal Federal Economic Indicators
Noteworthy


The Latest
U.S. International Trade in Goods and Services, June 2000
Many of BEA's tables are very wide. Printing tips are available.
Corrected Gross Domestic Product, Second Quarter 2000 "advance" estimate and revised estimates for 1997:I through 2000:I
The entire release is available in PDF format.
U.S. International Trade in Goods and Services, May 2000
Many of BEA's tables are very wide. Printing tips are available.
Transportation Satellite Accounts, 1996
Many of BEA's tables are very wide. Printing tips are available. In addition, this release is available in Adobe Acrobat (PDF) format. -->
International Investment Position of the United States, 1999
Many of BEA's tables are very wide. Printing tips are available.
Gross Domestic Product, First Quarter 2000 "final" estimate
The entire release is available in PDF format.
U.S. International Trade in Goods and Services, April 2000
Many of BEA's tables are very wide. Printing tips are available.