BEA 18-67
Scheduled Date
December 12 08:30:am
Release Title
Gross Domestic Product by County, Prototype Estimates, 2012-2015

An official website of the United States government
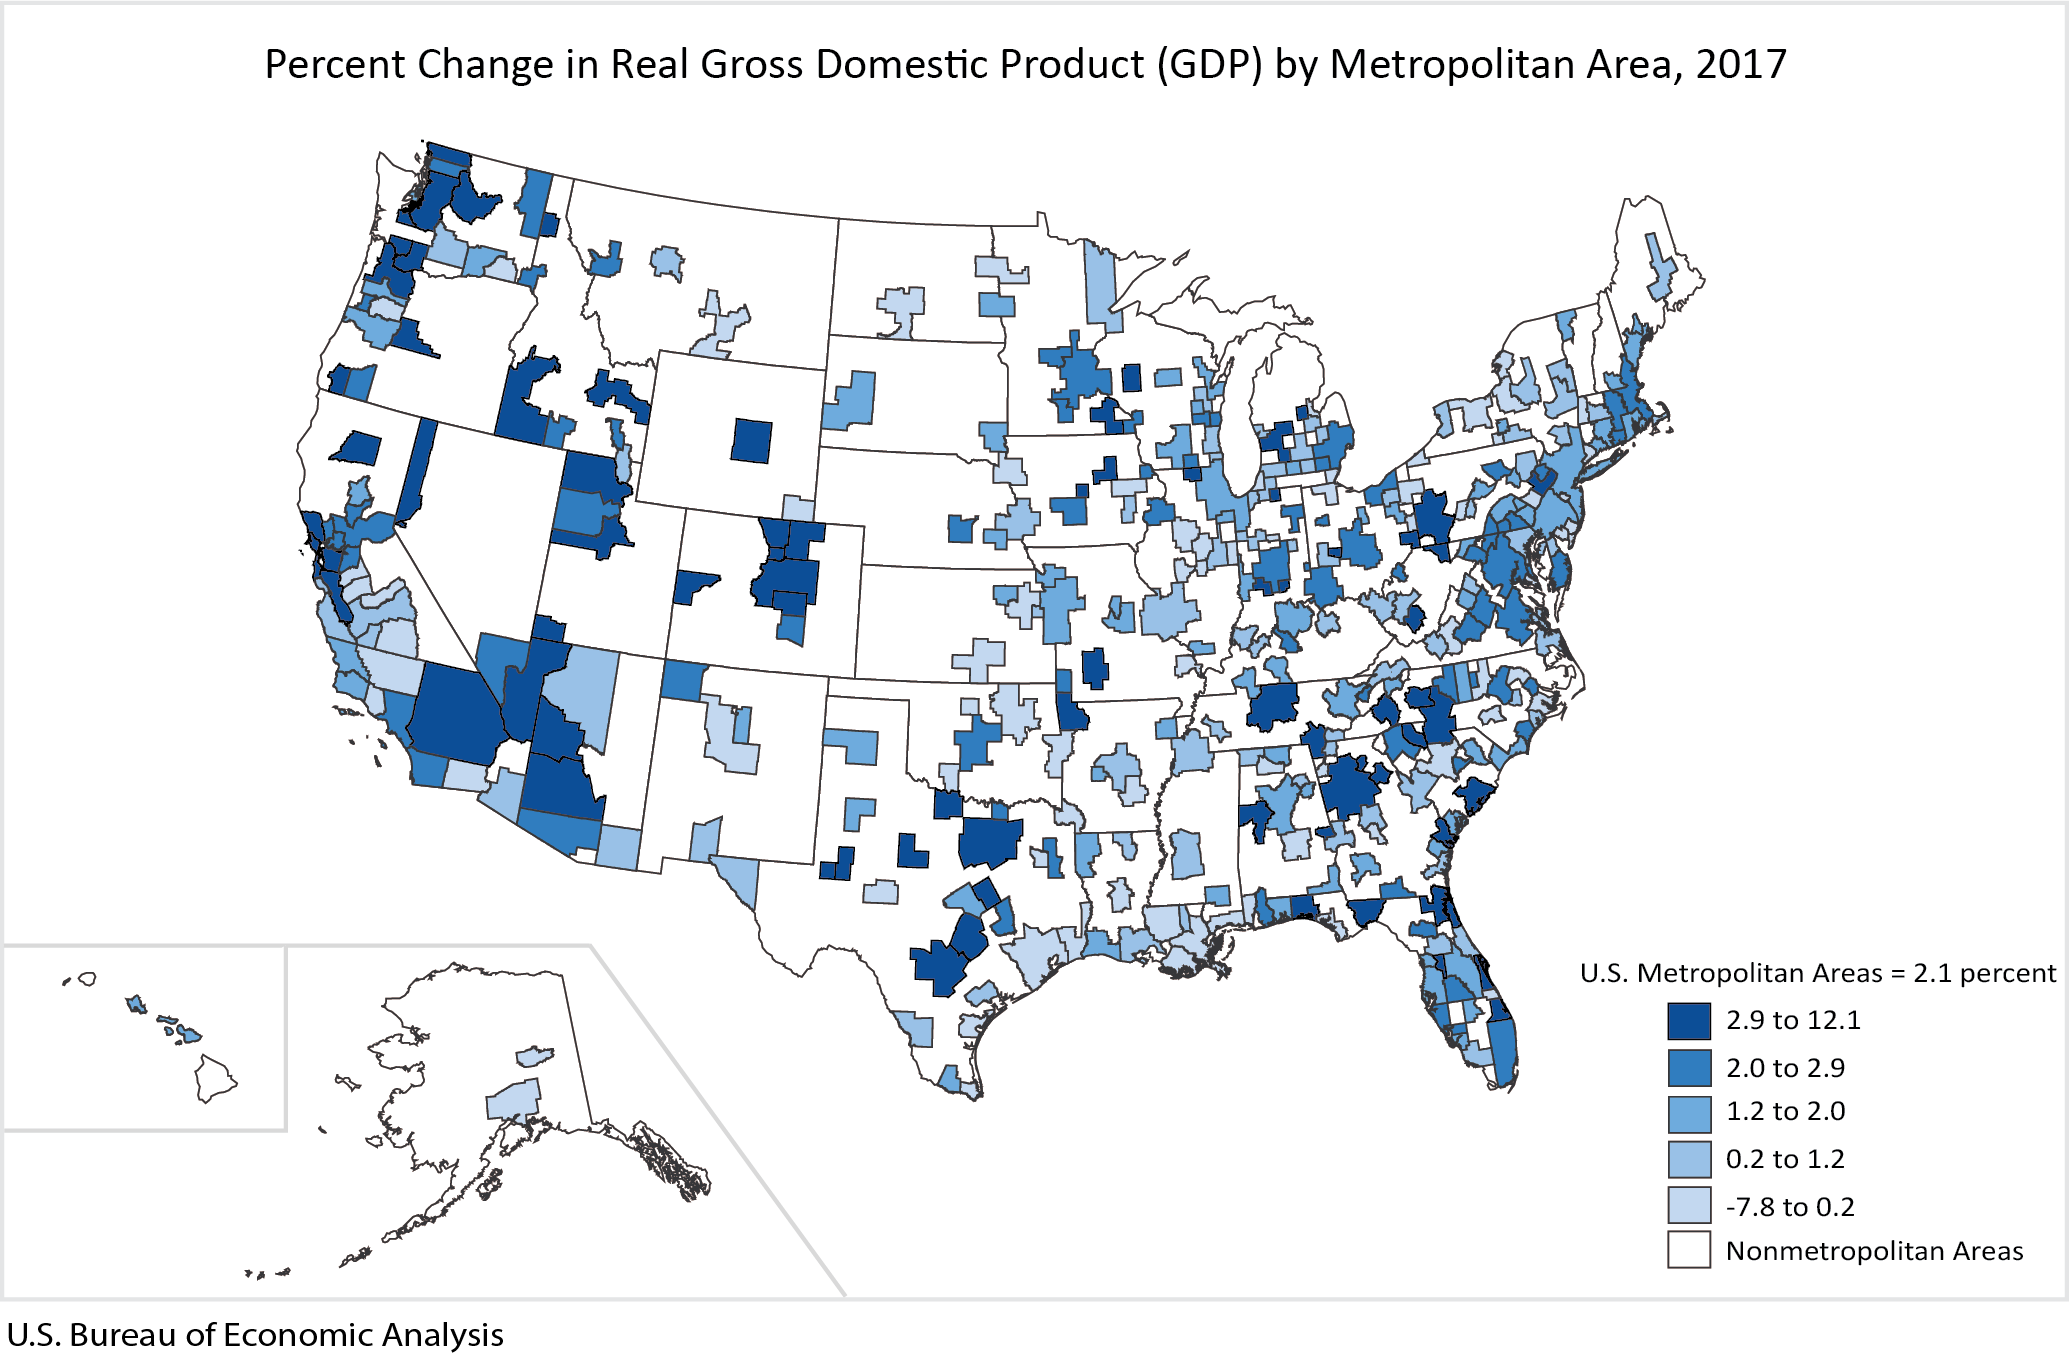
Real gross domestic product (GDP) increased in 312 out of 383 metropolitan areas in 2017. The percent change in real GDP by metropolitan area ranged from 12.1 percent in Odessa, TX to -7.8 percent in Enid, OK.
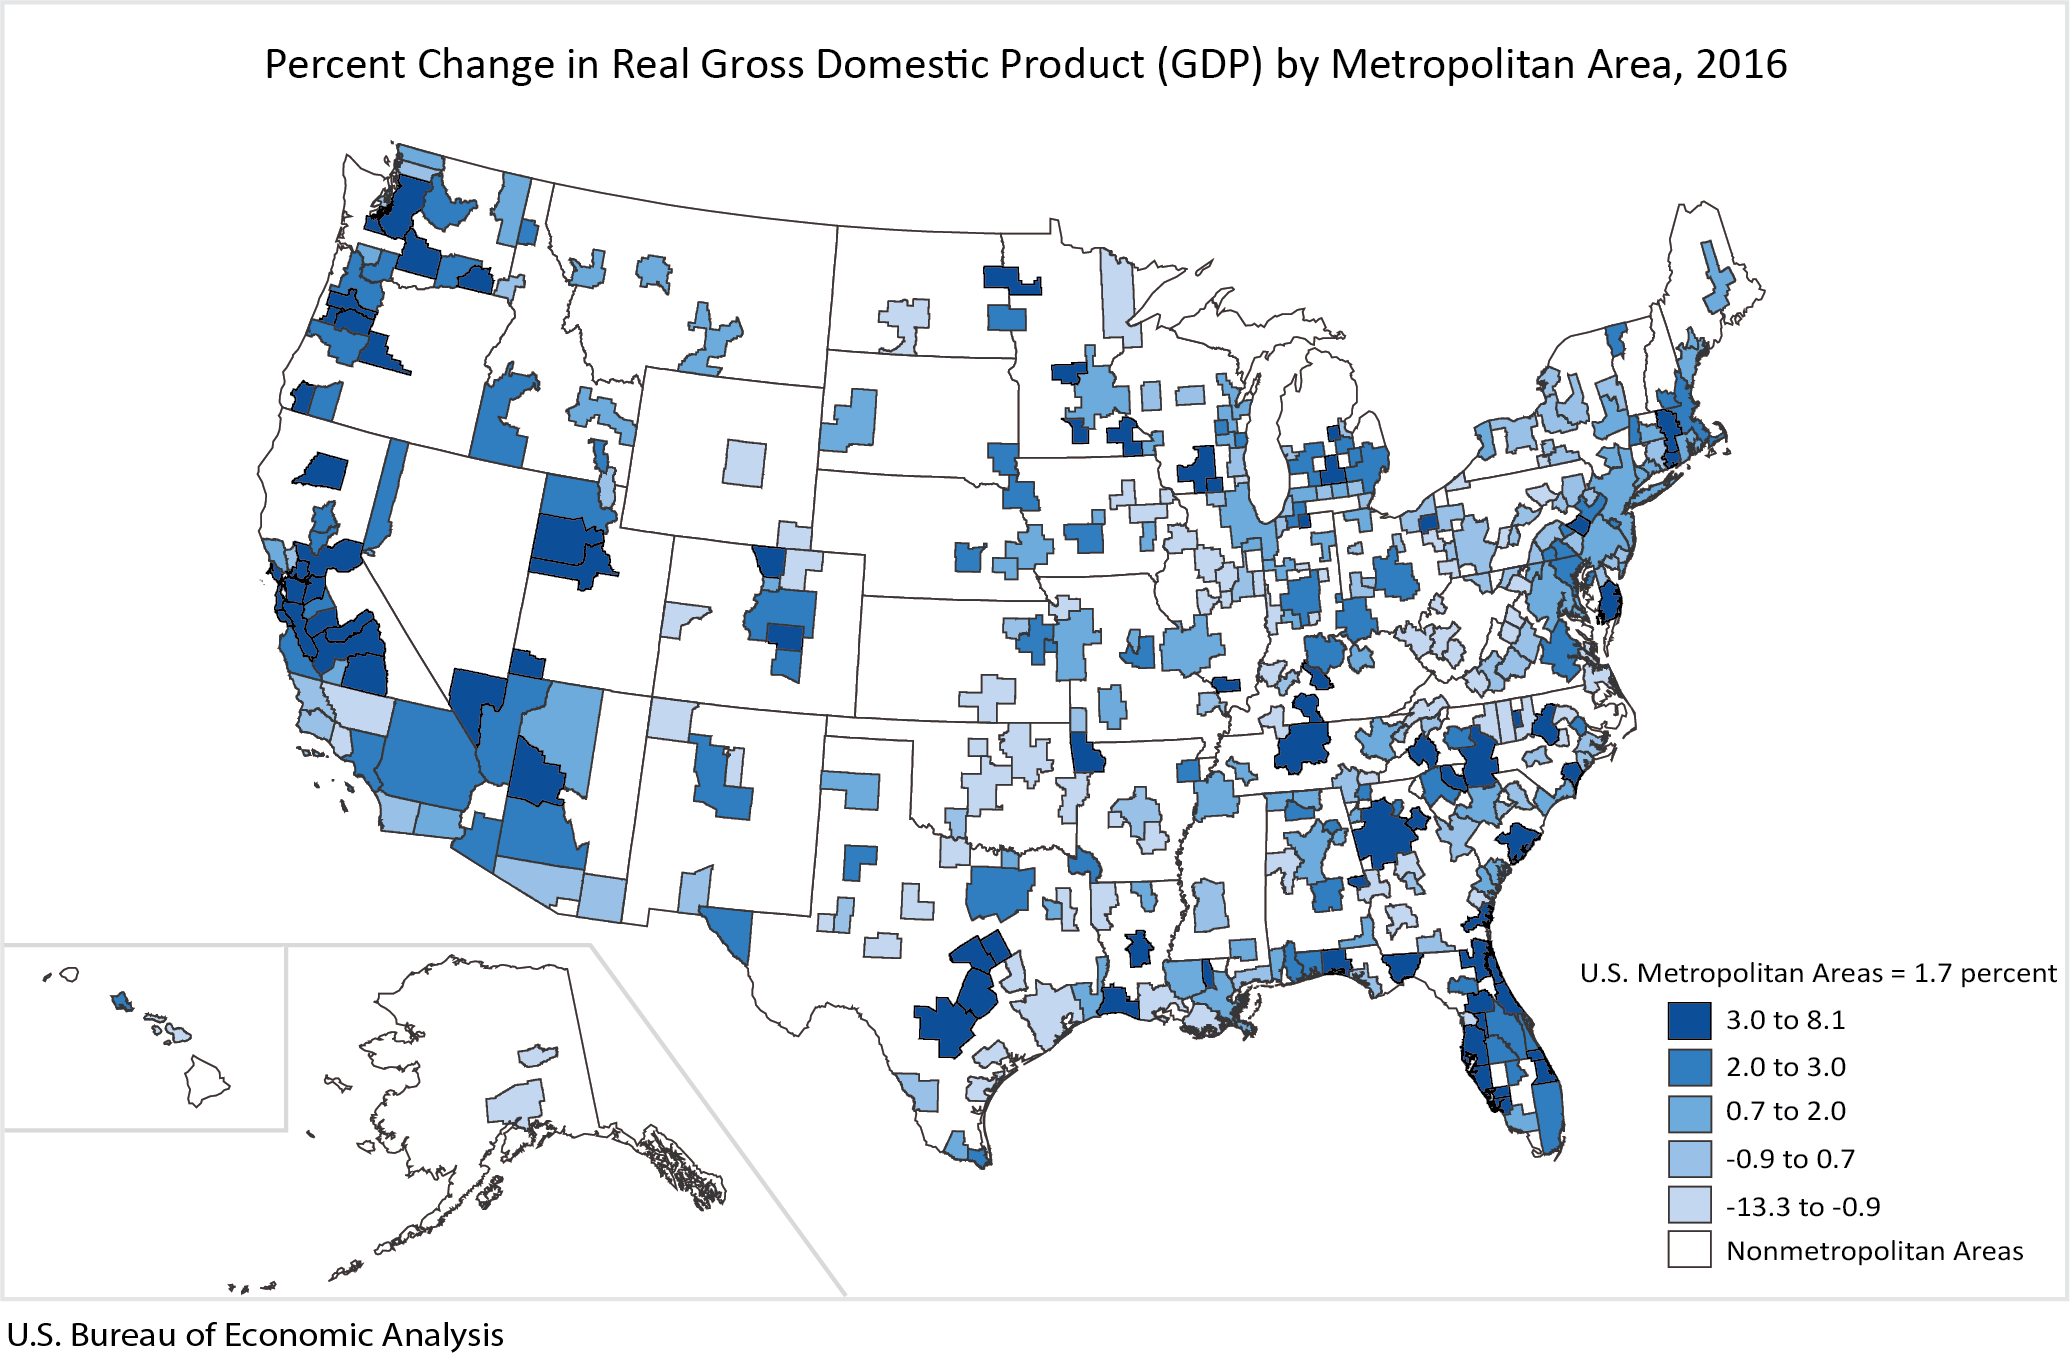
Real gross domestic product (GDP) increased in 267 out of 382 metropolitan areas in 2016 according to statistics on the geographic breakout of GDP released by the Bureau of Economic Analysis. Real GDP by metropolitan area growth ranged from 8.1 percent in Lake Charles, LA and Bend-Redmond, OR to -13.3 percent in Odessa, TX (table 2).