May 06, 2025

U.S. International Trade in Goods and Services, March 2025

The U.S. monthly international trade deficit increased in March 2025 according to the U.S. Bureau of Economic Analysis and the U.S. Census Bureau. The deficit increased from $123.2 billion in February (revised) to $140.5 billion in March, as imports increased more than exports. The goods deficit increased $16.5 billion in March to $163.5 billion. The services surplus decreased $0.8 billion in March to $23.0 billion.

Principal Federal Economic Indicators

Gross Domestic Product
Q1 2025 (Adv)
-0.3%
Personal Income
March 2025
+0.5%
International Trade in Goods and Services
March 2025
-$140.5 B
International Transactions
Q4 2024
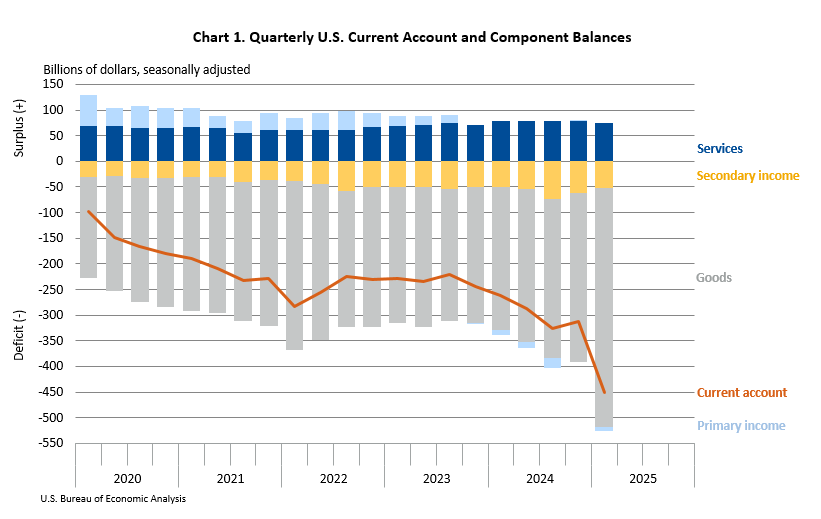
-$303.9 B

Noteworthy

The Latest

Gross Domestic Product, 2nd quarter 2013 (third estimate); Corporate Profits, 2nd quarter 2013 (revised estimate)

September 26, 2013 | News Release

Real gross domestic product -- the output of goods and services produced by labor and property located in the United States -- increased at an annual rate of 2.5 percent in the second quarter of 2013 (that is, from the first quarter to the second quarter), according to the "third" estimate released by the Bureau of Economic Analysis. In the first quarter, real GDP increased 1.1 percent. The GDP estimate released today is based on…

Value of Foreign Investments in the United States and U.S. Investments Abroad Decreased in Second Quarter 2013

September 24, 2013 | The BEA Wire

The U.S. net international investment position was –$4,504.1 billion (preliminary) at the end of the second quarter of 2013 compared with –$4,236.6 billion (revised) at the end of the first quarter, as the value of foreign investments in the United States exceeded the value of U.S. investments abroad.

U.S. International Investment Position, 2nd quarter 2013

September 24, 2013 | News Release

The U.S. net international investment position at the end of the second quarter of 2013 was -$4,504.1 billion (preliminary) as the value of foreign investments in the United States exceeded the value of U.S. investments abroad (table 1). At the end of the first quarter, the U.S. net international investment position was -$4,236.6 billion (revised).

Travel and Tourism Spending Decelerated in the Second Quarter of 2013

September 20, 2013 | The BEA Wire

Real spending on travel and tourism decelerated in the second quarter of 2013, increasing at an annual rate of 2.5 percent after increasing 7.3 percent revised) in the first quarter of 2013.

A New Look at State-Level R&D by Multinational Companies

September 20, 2013 | The BEA Wire

The amount of research and development (R&D) generated by multinational companies varies widely across U.S. states.

A new examination of data shows that the R&D performed by foreign-owned U.S. affiliates in 2007 ranged from $1 million in South Dakota to $5.3 billion in California. In addition to California, the R&D of U.S. affiliates was higher than $2.5 billion in three other states: New Jersey, Pennsylvania, and…

Travel and Tourism Satellite Accounts, 2nd quarter 2013

September 20, 2013 | News Release

Real spending on travel and tourism decelerated in the second quarter of 2013, increasing at an annual rate of 2.5 percent after increasing 7.3 percent (revised) in the first quarter of 2013. By comparison, growth in real gross domestic product (GDP) accelerated, increasing 2.5 percent (second estimate) in the second quarter after increasing 1.1 percent in the first quarter.

U.S. Current-Account Deficit Decreases in Second Quarter 2013

September 19, 2013 | The BEA Wire

The U.S. current-account deficit—the combined balances on trade in goods and services, income, and net unilateral current transfers—decreased to $98.9 billion (preliminary) in the second quarter of 2013 from $104.9 billion (revised) in the first quarter of 2013.

U.S. International Transactions, 2nd quarter 2013

September 19, 2013 | News Release

NOTE: See the navigation bar at the right side of the news release text for links to data tables, contact personnel and their telephone numbers, and supplementary materials. -->

Sarah P. Scott: (202) 606-9286 (Data) Paul W. Farello: (202) 606-9561 (Revisions)


Economic Growth Widespread Across Metropolitan Areas in 2012

September 17, 2013 | The BEA Wire

Metropolitan areas accounted for nearly 91 percent of national current-dollar gross domestic product (GDP). The ten largest metropolitan areas accounted for 34 percent of national GDP in 2012, while the smallest 79 metropolitan areas accounted for less than 2 percent of national GDP. Real GDP grew in 305 metropolitan areas. Durable-goods manufacturing, trade, and financial activities led growth in 2012.

Gross Domestic Product by Metropolitan Area, 2012 and Revised 2001-2011

September 17, 2013 | News Release

ECONOMIC GROWTH WIDESPREAD ACROSS METROPOLITAN AREAS IN 2012 Advance 2012, and Revised 20012011 GDP-by-Metropolitan-Area Statistics