Notice
Due to a lapse in appropriations, this website is not being updated.
Bureau of Economic Analysis
U.S. International Investment Position, 2nd Quarter 2025
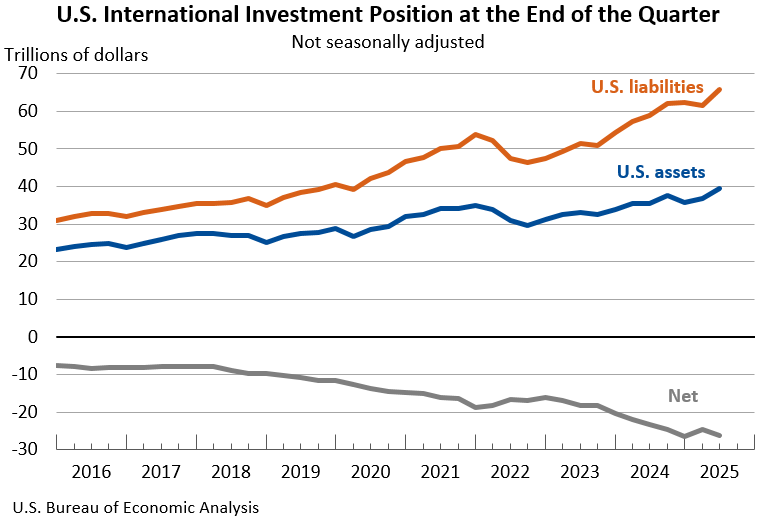
The U.S. net international investment position, the difference between U.S. residents’ foreign financial assets and liabilities, was -$26.14 trillion at the end of the second quarter of 2025, according to statistics released today by the U.S. Bureau of Economic Analysis. Assets totaled $39.56 trillion, and liabilities were $65.71 trillion. At the end of the first quarter, the net investment position was -$24.65 trillion (revised).
Principal Federal Economic Indicators
Noteworthy
The Latest
GDP Statistics for U.S. Counties Coming Dec. 12
For the first time, the Bureau of Economic Analysis is measuring the gross domestic product of the more than 3,000 counties in the United States. Prototype GDP statistics for each county will be published on our website Dec. 12.
Durable Goods Spending Rises in September
Personal income increased 0.2 percent in September after increasing 0.4 percent in August. Wages and salaries, the largest component of personal income, increased 0.2 percent in September after increasing 0.5 percent in August.
Personal Income and Outlays, September 2018
Personal income increased 0.2 percent in September after increasing 0.4 percent in August. Wages and salaries, the largest component of personal income, increased 0.2 percent in September after increasing 0.5 percent in August.
GDP Increases in Third Quarter
Real gross domestic product (GDP) increased 3.5 percent in the third quarter of 2018, according to the “advance” estimate released by the Bureau of Economic Analysis. In the second quarter of 2018, real GDP increased 4.2 percent.
GDP highlights
Gross Domestic Product, 3rd quarter 2018 (advance estimate)
Real gross domestic product (GDP) increased 3.5 percent in the third quarter of 2018, according to the “advance” estimate released by the Bureau of Economic Analysis. In the second quarter of 2018, real GDP increased 4.2 percent.
CNMI GDP Increases in 2017
The estimates of GDP for the CNMI show that real GDP—GDP adjusted to remove price changes—increased 25.1 percent in 2017 after increasing 28.2 percent in 2016. For comparison, real GDP for the United States (excluding the territories) increased 2.2 percent in 2017 after increasing 1.6 percent in 2016.
Northern Mariana Islands’ GDP Increases in 2017
The estimates of GDP for the Commonwealth of the Northern Mariana Islands show that real GDP—GDP adjusted to remove price changes—increased 25.1 percent in 2017, after increasing 28.2 percent in 2016. For comparison, real GDP for the United States (excluding the territories) increased 2.2 percent in 2017 after increasing 1.6 percent in 2016.
August 2018 Trade Gap is $53.2 Billion
The U.S. monthly international trade deficit increased in August 2018 according to the U.S. Bureau of Economic Analysis and the U.S. Census Bureau. The deficit increased from $50.0 billion in July (revised) to $53.2 billion in August, as exports decreased and imports increased. The previously published July deficit was $50.1 billion. The goods deficit increased $3.6 billion in August to $76.7 billion. The services surplus increased $0.4…
U.S. International Trade in Goods and Services, August 2018
The U.S. Census Bureau and the U.S. Bureau of Economic Analysis announced today that the goods and services deficit was $53.2 billion in August, up $3.2 billion from $50.0 billion in July, revised. August exports were $209.4 billion, $1.7 billion less than July exports. August imports were $262.7 billion, $1.5 billion more than July imports.
Personal Consumption Expenditures by State, 2017
State personal consumption expenditures (PCE) increased on average 4.3 percent in 2017, an acceleration from the 3.8 percent increase in 2016. The percent change in PCE across all states ranged from 6.9 percent in Idaho to 2.0 percent in North Dakota.


