Bureau of Economic Analysis
Personal Income and Outlays, July 2025
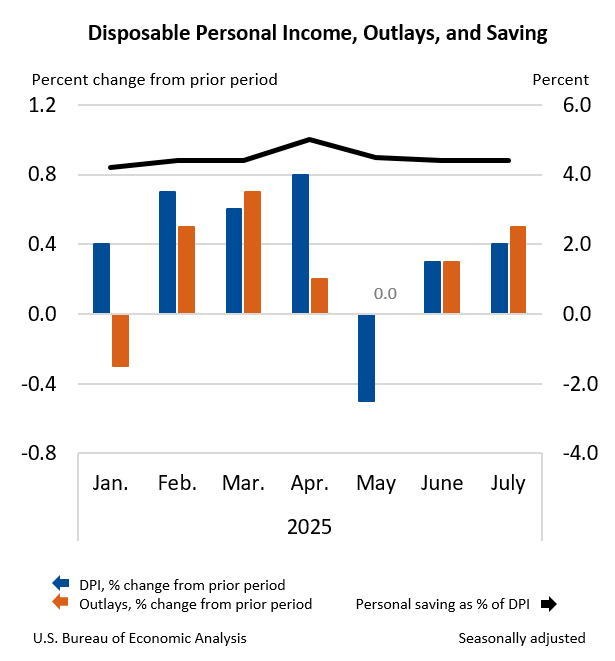
Personal income increased $112.3 billion (0.4 percent at a monthly rate) in July, according to estimates released today by the U.S. Bureau of Economic Analysis. Disposable personal income (DPI)—personal income less personal current taxes—increased $93.9 billion (0.4 percent) and personal consumption expenditures (PCE) increased $108.9 billion (0.5 percent). Personal outlays—the sum of PCE, personal interest payments, and personal current transfer payments—increased $110.9 billion in July. Personal saving was $985.6 billion in July and the personal saving rate—personal saving as a percentage of disposable personal income—was 4.4 percent.
Principal Federal Economic Indicators
Noteworthy
- 2025 News Release Schedule
- Innovation at BEA
- 2025 Annual Updates
- Distribution of Personal Income Nowcast
- New! Services Trade Data for More Countries
- Data Tool: Trade in Value Added
- Updated: RIMS II Regional Multipliers
- Arts and Culture
- Space Economy
- FDI Now in State BEARFACTS
- Quick Guide: Price Indexes
The Latest
Real Estate and Rental and Leasing Led Growth in the First Quarter
Real estate and rental and leasing; mining; and durable goods manufacturing were the leading contributors to the increase in U.S. economic growth in the first quarter of 2017. Overall, 13 of 22 industry groups contributed to the 1.4 percent increase in real GDP in the first quarter.
Gross Domestic Product by Industry, 1st quarter 2017
Real estate and rental and leasing; mining; and durable goods manufacturing were the leading contributors to the increase in U.S. economic growth in the first quarter of 2017. According to gross domestic product (GDP) by industry statistics released by the Bureau of Economic Analysis, 13 of 22 industry groups contributed to the overall 1.4 percent increase in real GDP in the first quarter.
June 2017
Upcoming in the Survey... Annual Update of the International Economic Accounts. A summary of the major sources of the revisions to these accounts for 2013–2016. Direct Investment Positions by Country and by Industry. A more detailed look at inward and outward direct investment in 2016. International Investment Position. A look at the positions at the end of 2016 and the first quarter of 2017. U.S.
New Foreign Direct Investment in the United States, 2014-2016
Expenditures by foreign direct investors to acquire, establish, or expand U.S. businesses were $373.4 billion in 2016, down $66.2 billion, or 15 percent, from $439.6 billion in 2015.
Expenditures by Foreign Direct Investors for New Investment in the United States, 2014 – 2016
Expenditures by foreign direct investors to acquire, establish, or expand U.S. businesses totaled $373.4 billion in 2016. Spending was down 15 percent from $439.6 billion in 2015, but was above the annual average of $350.0 billion for 2014-2015, and was well above the annual average of $226.0 billion for 2006-2008. As in previous years, expenditures to acquire existing businesses accounted for a large majority of the total.
It's Nearly Time for the Summer Ritual of Updating GDP Numbers
The annual update of gross domestic product is coming soon. As it does every summer, the Bureau of Economic Analysis will revisit its earlier GDP estimates and other national data and make some changes. Does that mean the older numbers were wrong?
No, and here’s why:
Send Us Your Suggestions About Outdoor Recreation Statistics
A notice in the Federal Register on June 26 opened a 30-day period for public comment about the first-of-its-kind Outdoor Recreation Satellite Account.
The project is a collaboration with the Federal Recreation Council, a group of seven agencies that are prominent stewards of public lands and waters. It was authorized by the Outdoor Recreation Jobs and Impact Act of 2016.
May 2017 Trade Gap is $46.5 Billion
The U.S. monthly international trade deficit decreased in May 2017 according to the U.S. Bureau of Economic Analysis and the U.S. Census Bureau. The deficit decreased from $47.6 billion in April (revised) to $46.5 billion in May, as exports increased and imports decreased. The previously published April deficit was $47.6 billion. The goods deficit decreased $0.9 billion in May to $67.5 billion. The services surplus increased $0.2 billion in…
U.S. International Trade in Goods and Services, May 2017
Total May exports of $192.0 billion and imports of $238.5 billion resulted in a goods and services deficit of $46.5 billion.
U.S. Net International Investment Position First Quarter 2017
The U.S. net international investment position increased to −$8,141.2 billion (preliminary) at the end of the first quarter of 2017 from −$8,318.4 billion (revised) at the end of the fourth quarter of 2016.*


