June 30, 2025

U.S. International Investment Position, 1st Quarter 2025 and Annual Update

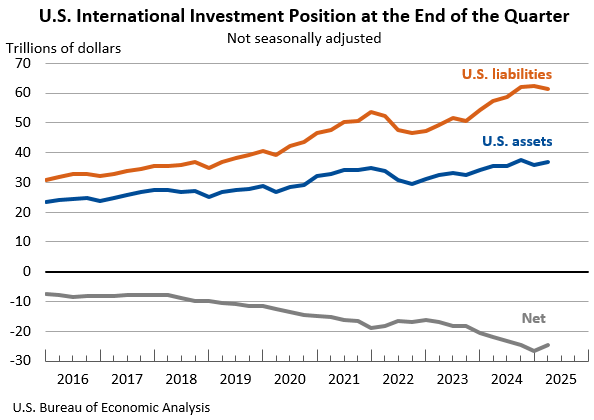
The U.S. net international investment position, the difference between U.S. residents’ foreign financial assets and liabilities, was -$24.61 trillion at the end of the first quarter of 2025, according to statistics released today by the U.S. Bureau of Economic Analysis. Assets totaled $36.85 trillion, and liabilities were $61.47 trillion. At the end of the fourth quarter of 2024, the net investment position was -$26.54 trillion (revised).
Principal Federal Economic Indicators

Gross Domestic Product
Q1 2025 (3rd)
-0.5%
Personal Income
May 2025
-0.4%
International Trade in Goods and Services
April 2025
-$61.6 B
International Transactions
Q1 2025
-$450.2 B

Noteworthy

The Latest

Personal Consumption Expenditures by State, 2017

October 4, 2018 | News Release

State personal consumption expenditures (PCE) increased on average 4.3 percent in 2017, an acceleration from the 3.8 percent increase in 2016. The percent change in PCE across all states ranged from 6.9 percent in Idaho to 2.0 percent in North Dakota.

Personal Income Rises in August

September 28, 2018 | The BEA Wire

Personal income increased 0.3 percent in August, the same increase as in July. Wages and salaries, the largest component of personal income, increased 0.5 percent in August after increasing 0.3 percent in July.

Personal Income and Outlays, August 2018

September 28, 2018 | News Release

Personal income increased 0.3 percent in August, the same increase as in July. Wages and salaries, the largest component of personal income, increased 0.5 percent in August after increasing 0.3 percent in July.

GDP Increases in Second Quarter

September 27, 2018 | The BEA Wire

Real gross domestic product (GDP) increased 4.2 percent in the second quarter of 2018, according to the “third” estimate released by the Bureau of Economic Analysis. The growth rate was unchanged from the “second” estimate released in August. In the first quarter, real GDP increased 2.2 percent.

GDP Highlights

Gross Domestic Product, 2nd quarter 2018 (third estimate); Corporate Profits, 2nd quarter 2018 (revised estimate)

September 27, 2018 | News Release

Real gross domestic product (GDP) increased at an annual rate of 4.2 percent in the second quarter of 2018, according to the "third" estimate released by the Bureau of Economic Analysis. In the first quarter, real GDP increased 2.2 percent.

U.S. Net International Investment Position Second Quarter 2018

September 26, 2018 | The BEA Wire

The U.S. net international investment position decreased to −$8,638.5 billion (preliminary) at the end of the second quarter of 2018 from −$7,747.3 billion (revised) at the end of the first quarter. The $891.2 billion decrease reflected net financial transactions of −$126.0 billion and net other changes in position, such as price and exchange-rate changes, of −$765.1 billion.

U.S. Net International Investment Position: Second Quarter 2018

September 26, 2018 | News Release

The U.S. net international investment position decreased to -$8,638.5 billion (preliminary) at the end of the second quarter of 2018 from -$7,747.3 billion (revised) at the end of the first quarter, according to statistics released by the Bureau of Economic Analysis (BEA).

State Personal Income: Second Quarter 2018

September 25, 2018 | The BEA Wire

State personal income increased 4.2 percent, at an annual rate, in the second quarter of 2018, a deceleration from the 5.0 percent increase in the first quarter. The percent change in personal income across all states ranged from 6.0 percent in Texas to 1.6 percent in Washington.

State Quarterly Personal Income, 2nd quarter 2018

September 25, 2018 | News Release

State personal income increased 4.2 percent, at an annual rate, in the second quarter of 2018, a deceleration from the 5.0 percent increase in the first quarter. The percent change in personal income across all states ranged from 6.0 percent in Texas to 1.6 percent in Washington.

Outdoor Recreation Grew Faster Than U.S. Economy in 2016

September 20, 2018 | The BEA Wire

The outdoor recreation economy accounted for 2.2 percent of current-dollar GDP in 2016, or $412 billion, updated statistics from the Outdoor Recreation Satellite Account show. In data produced for the first time, using inflation-adjusted GDP, the outdoor recreation economy grew 1.7 percent in 2016, faster than the 1.6 percent growth for the overall U.S. economy.

Real gross output, compensation, and employment all grew faster in…