
Bureau of Economic Analysis
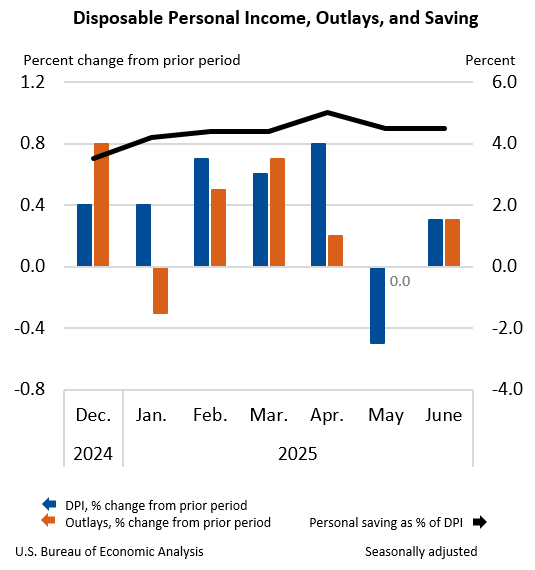
Personal Income and Outlays, June 2025
Personal income increased $71.4 billion (0.3 percent at a monthly rate) in June, according to estimates released today by the U.S. Bureau of Economic Analysis. Disposable personal income (DPI)—personal income less personal current taxes—increased $61.0 billion (0.3 percent) and personal consumption expenditures (PCE) increased $69.9 billion (0.3 percent). Personal outlays—the sum of PCE, personal interest payments, and personal current transfer payments—increased $69.5 billion in June. Personal saving was $1.01 trillion in June and the personal saving rate—personal saving as a percentage of disposable personal income—was 4.5 percent.
Principal Federal Economic Indicators
Noteworthy
- 2025 News Release Schedule
- Innovation at BEA
- 2025 Annual Updates
- New! Services Trade Data for More Countries
- Data Tool: Trade in Value Added
- Distribution of State Personal Income
- Updated: RIMS II Regional Multipliers
- Arts and Culture
- Space Economy
- FDI Now in State BEARFACTS
- Quick Guide: Price Indexes


The Latest
Personal Income by State, 2021 (Preliminary)
State personal income increased 7.4 percent in 2021 after increasing 6.6 percent in 2020. In 2021, increases in earnings, transfer receipts, and property income (dividends, interest, and rent) contributed to personal income growth in all states and the District of Columbia. The percent change in personal income across all states ranged from 9.6 percent in Idaho to 4.5 percent in Vermont.
Personal Income by State, 2021 (Preliminary) and 4th Quarter 2021
State personal income increased 7.4 percent in 2021 after increasing 6.6 percent in 2020. In 2021, increases in earnings, transfer receipts, and property income (dividends, interest, and rent) contributed to personal income growth in all states and the District of Columbia. The percent change in personal income across all states ranged from 9.6 percent in Idaho to 4.5 percent in Vermont.
Arts and Culture Economy Declines 6.4 Percent in 2020
Arts and cultural economic activity decreased an inflation-adjusted 6.4 percent in 2020, after increasing 3.4 percent in 2019, according to statistics released today by the U.S. Bureau of Economic Analysis.
Arts and cultural economic activity accounted for 4.2 percent of gross domestic product (GDP), or $876.7 billion, in 2020, the Arts and Cultural Production Satellite Account shows.
Arts and Cultural Production Satellite Account, U.S. and States, 2020
The Arts and Cultural Production Satellite Account released today by the U.S. Bureau of Economic Analysis (BEA) shows that arts and cultural economic activity, adjusted for inflation, decreased 6.4 percent in 2020 after increasing 3.4 percent in 2019. Arts and cultural economic activity accounted for 4.2 percent of gross domestic product (GDP), or $876.7 billion, in 2020.
2021 Trade Gap is $861.4 Billion
The U.S. international trade deficit increased in 2021 according to the U.S. Bureau of Economic Analysis and the U.S. Census Bureau. The deficit increased from $676.7 billion in 2020 to $861.4 billion in 2021, as imports increased more than exports. The goods deficit increased $169.4 billion in 2021 to $1,091.4 billion. The services surplus decreased $15.3 billion in 2021 to $230.0 billion. The goods and services deficit was 3.7 percent of…
January 2022 Trade Gap is $89.7 Billion
The U.S. monthly international trade deficit increased in January 2022 according to the U.S. Bureau of Economic Analysis and the U.S. Census Bureau. The deficit increased from $82.0 billion in December (revised) to $89.7 billion in January, as imports increased and exports decreased. The previously published December deficit was $80.7 billion. The goods deficit increased $7.1 billion in January to $108.9 billion. The services surplus…
U.S. International Trade in Goods and Services, January 2022
The U.S. monthly international trade deficit increased in January 2022 according to the U.S. Bureau of Economic Analysis and the U.S. Census Bureau. The deficit increased from $82.0 billion in December (revised) to $89.7 billion in January, as imports increased and exports decreased. The previously published December deficit was $80.7 billion. The goods deficit increased $7.1 billion in January to $108.9 billion. The services surplus decreased $…
Gross Domestic Product for the U.S. Virgin Islands, 2020
Real gross domestic product (GDP) for the U.S. Virgin Islands (USVI) decreased 2.2 percent in 2020 after increasing 2.8 percent in 2019. The decrease in real GDP reflected decreases in exports of services, private fixed investment, personal consumption expenditures, and government spending. These decreases were partly offset by an increase in private inventory investment.
Gross Domestic Product for the U.S. Virgin Islands, 2020
Real gross domestic product for the U.S. Virgin Islands decreased 2.2 percent in 2020 after increasing 2.8 percent in 2019, according to statistics released today by the U.S. Bureau of Economic Analysis.
Innovation at BEA: New Data Projects
The Bureau of Economic Analysis continually explores the development of new statistics as part of its mission to provide Americans a timely, accurate, and in-depth understanding of the changing U.S. economy. These are some of the ways we’re working to expand economic data.