Bureau of Economic Analysis
U.S. International Trade in Goods and Services, July 2025
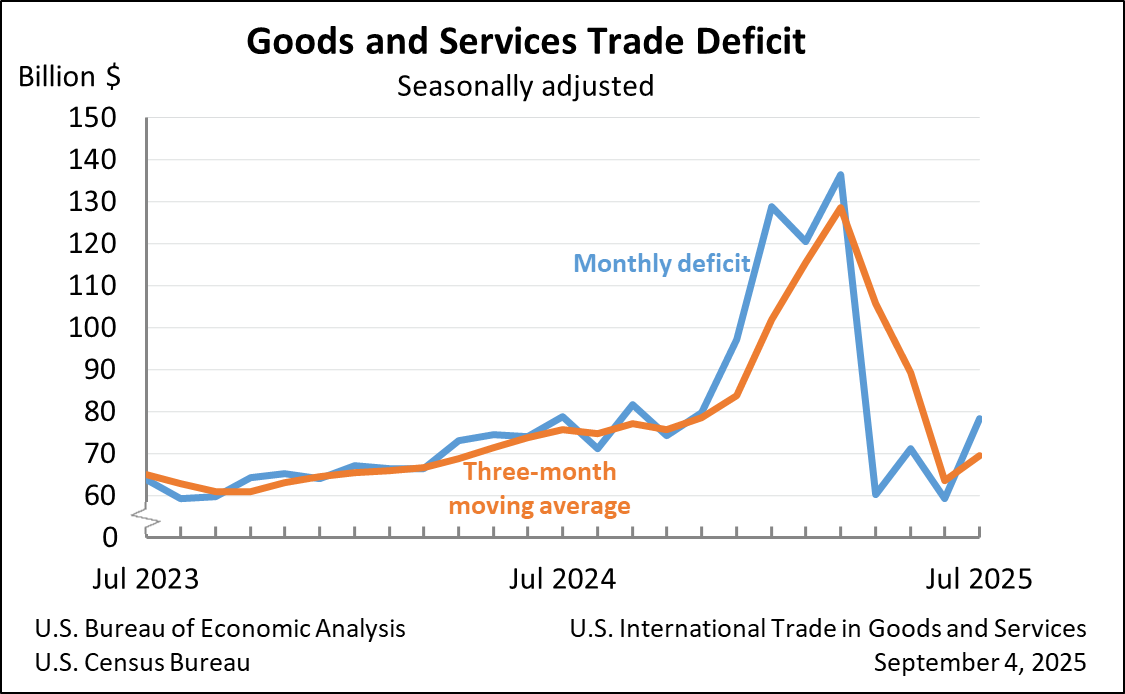
The U.S. goods and services trade deficit increased in July 2025 according to the U.S. Bureau of Economic Analysis and the U.S. Census Bureau. The deficit increased from $59.1 billion in June (revised) to $78.3 billion in July, as imports increased more than exports. The goods deficit increased $18.2 billion in July to $103.9 billion. The services surplus decreased $1.1 billion in July to $25.6 billion.
Principal Federal Economic Indicators
Noteworthy
The Latest
State Quarterly Personal Income, 4th quarter 2017; State Annual Personal Income, 2017 (preliminary)
State personal income increased 3.1 percent on average in 2017, after increasing 2.3 percent in 2016. In 2017, personal income increased in all states and the District of Columbia except one, North Dakota. The percent change in personal income across all states ranged from 4.8 percent in Washington to -0.3 percent in North Dakota.
U.S. Current-Account Deficit Increases in Fourth Quarter 2017
The U.S. current-account deficit increased to $128.2 billion (preliminary) in the fourth quarter of 2017 from $101.5 billion (revised) in the third quarter of 2017. As a percentage of U.S. GDP, the deficit increased to 2.6 percent from 2.1 percent. The previously published current-account deficit for the third quarter was $100.6 billion.
U.S. International Transactions, 4th quarter and Year 2017
The U.S. current-account deficit increased to $128.2 billion (preliminary) in the fourth quarter of 2017 from $101.5 billion (revised) in the third quarter of 2017. As a percentage of U.S. GDP, the deficit increased to 2.6 percent from 2.1 percent. The previously published current-account deficit for the third quarter was $100.6 billion.
Initial Estimates Show Digital Economy Accounted for 6.5 Percent of GDP in 2016
The Bureau of Economic Analysis released, for the first time, preliminary statistics and an accompanying report exploring the size and growth of the digital economy. Goods and services that are primarily digital accounted for 6.5 percent of the U.S. economy, or $1.2 trillion, in 2016, after a decade of growing faster than the U.S. economy overall, BEA’s research shows.
From 2006 to 2016, the digital economy grew at an average annual…
Initial Statistics on the Size and Growth of the Digital Economy to be Released Thursday
The Bureau of Economic Analysis will release, for the first time, preliminary statistics and an accompanying report exploring the size and growth of the digital economy at 10:30 a.m. on Thursday, March 15.
The report will be available at BEA’s website, www.bea.gov.
The report will include in its definition of the digital economy three major types of goods and services:
BEA Works with Partners to Understand Differences in Bilateral Trade Statistics
Trade statistics produced by the Bureau of Economic Analysis provide policymakers and other stakeholders with critical information for understanding the role of the United States in the global economy. As the size and complexity of international transactions have increased, BEA is working on a number of fronts to make its trade statistics even better.
January 2018 Trade Gap is $56.6 Billion
The U.S. monthly international trade deficit increased in January 2018 according to the U.S. Bureau of Economic Analysis and the U.S. Census Bureau. The deficit increased from $53.9 billion in December (revised) to $56.6 billion in January, as exports decreased more than imports. The previously published December deficit was $53.1 billion. The goods deficit increased $2.8 billion in January to $76.5 billion. The services surplus increased $0.…
2017 Trade Gap is $568.4 Billion
The U.S. international trade deficit increased in 2017 according to the U.S. Bureau of Economic Analysis and the U.S. Census Bureau. The deficit increased from $504.8 billion in 2016 to $568.4 billion in 2017, as imports increased more than exports. As a percentage of U.S. gross domestic product, the goods and services deficit was 2.9 percent in 2017, up from 2.7 percent in 2016. The goods deficit increased from $752.5 billion in 2016 to $811…
U.S. International Trade in Goods and Services, January 2018
The U.S. monthly international trade deficit increased in January 2018 according to the U.S. Bureau of Economic Analysis and the U.S. Census Bureau. The deficit increased from $53.9 billion in December (revised) to $56.6 billion in January, as exports decreased more than imports. The previously published December deficit was $53.1 billion. The goods deficit increased $2.8 billion in January to $76.5 billion. The services surplus increased $0.1…
Arts and Cultural Production Satellite Account, U.S. and States 2015
The Arts and Cultural Production Satellite Account (ACPSA) released today by the U.S. Department of Commerce's Bureau of Economic Analysis (BEA) show that arts and cultural economic activity nationwide increased an inflation-adjusted 4.9 percent in 2015. That compares with a 0.4 percent increase in 2014 (table 1). Arts and cultural economic activity accounted for 4.2 percent of gross domestic product (GDP), or $763.6 billion, in 2015 (table…


