
Bureau of Economic Analysis
U.S. International Trade in Goods and Services, March 2026
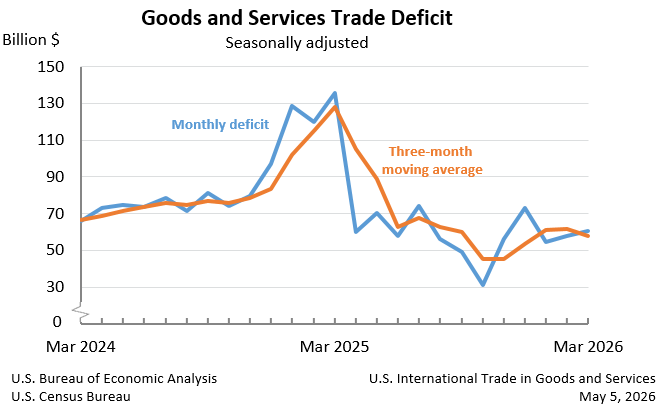
The U.S. monthly international trade deficit increased in March 2026 according to the U.S. Bureau of Economic Analysis and the U.S. Census Bureau. The deficit increased from $57.8 billion in February (revised) to $60.3 billion in March, as imports increased more than exports. The goods deficit increased $4.1 billion in March to $88.7 billion. The services surplus increased $1.6 billion in March to $28.4 billion.
Principal Federal Economic Indicators
Noteworthy


The Latest
How BEA’s Numbers Come Together
A blog post from BEA Director Vipin Arora
My guess is that the standards and methods we use at BEA to put our statistics together are a bit different than people might expect. Understandably so—most people think about statistics in terms of surveys, so concepts like response rates, sample size, margin of error, and standard deviation are usually top of mind.
We do some of that. But most of our economic indicators are…
U.S. International Trade in Goods and Services, March 2026
The U.S. monthly international trade deficit increased in March 2026 according to the U.S. Bureau of Economic Analysis and the U.S. Census Bureau. The deficit increased from $57.8 billion in February (revised) to $60.3 billion in March, as imports increased more than exports. The goods deficit increased $4.1 billion in March to $88.7 billion. The services surplus increased $1.6 billion in March to $28.4 billion.
Looking for Supply Chain Intel? Explore BEA’s Supply and Use Tables
A blog post from BEA Director Vipin Arora
I’ve written in the past about how BEA’s supply and use tables are the unsung hero of economic accounting. They do a lot, including providing the framework for modern economic measurement and analysis. But did you know they are also central to understanding supply chains?
Personal Income and Outlays, March 2026
Personal income increased $149.2 billion (0.6 percent at a monthly rate) in March, according to estimates released today by the U.S. Bureau of Economic Analysis (BEA). Disposable personal income (DPI)—personal income less personal current taxes—increased $142.5 billion (0.6 percent), and personal consumption expenditures (PCE) increased $195.4 billion (0.9 percent). Personal outlays—the sum of PCE, personal interest payments, and personal…
GDP (Advance Estimate), 1st Quarter 2026
Real gross domestic product (GDP) increased at an annual rate of 2.0 percent in the first quarter of 2026 (January, February, and March), according to the advance estimate released today by the U.S. Bureau of Economic Analysis. In the fourth quarter of 2025, real GDP increased 0.5 percent. The contributors to the increase in real GDP in the first quarter were investment, exports, consumer spending, and government spending. Imports, which are a…
When Are Data and Tractors Treated the Same in Economic Accounting?
A blog post from BEA Director Vipin Arora
I’ve struggled over the years with some basic grammar (and I know I’m not the only one). It’s hard for me to remember what an adverb is, or to pick out a simile versus a metaphor. You can add treating the word data as plural to that list. Saying “the data are” instead of the “the data is” doesn’t sound right to me, even though I know that the singular usage has arisen only in recent years…
GDP (Third Estimate), Industries, Corporate Profits, State GDP, and State Personal Income, 4th Quarter and Year 2025
Real gross domestic product (GDP) increased at an annual rate of 0.5 percent in the fourth quarter of 2025 (October, November, and December), according to the third estimate released today by the U.S. Bureau of Economic Analysis. In the third quarter of 2025, real GDP increased 4.4 percent. The contributors to the increase in real GDP in the fourth quarter were increases in consumer spending and investment. These movements were partly offset by…
Personal Income and Outlays, February 2026
Personal income decreased $18.2 billion (0.1 percent at a monthly rate) in February, according to estimates released today by the U.S. Bureau of Economic Analysis. Disposable personal income (DPI)—personal income less personal current taxes—decreased $18.3 billion (0.1 percent), and personal consumption expenditures (PCE) increased $103.2 billion (0.5 percent). Personal outlays—the sum of PCE, personal interest payments, and personal current…
U.S. International Trade in Goods and Services, February 2026
The U.S. monthly international trade deficit increased in February 2026 according to the U.S. Bureau of Economic Analysis and the U.S. Census Bureau. The deficit increased from $54.7 billion in January (revised) to $57.3 billion in February, as imports increased more than exports. The goods deficit increased $2.5 billion in February to $84.6 billion. The services surplus decreased $0.2 billion in February to $27.3 billion.
Delving Inside Global Value Chains: Expanded Data Coming Soon
A blog post from BEA Director Vipin Arora
I’d bet most people have heard of global supply chains. But are you familiar with their fraternal twin, global value chains? I’m guessing not. BEA’s statistics on value chains are an underappreciated tool that can help policymakers and the public better understand supply chains.