Bureau of Economic Analysis
Annual Update of GDP, Industry, and State Statistics Starts Sept. 25
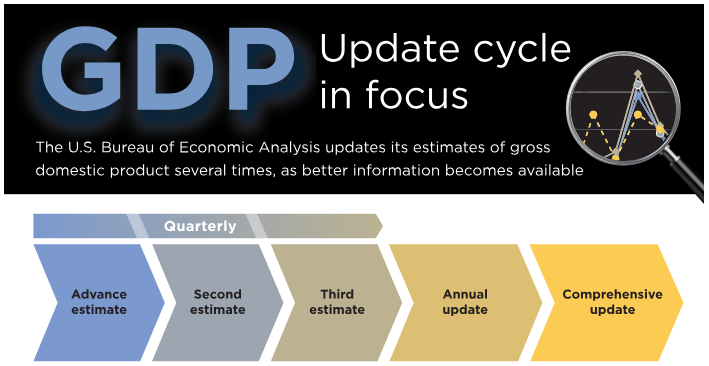
Release of the annual update of gross domestic product and related statistics, including GDP by industry, begins Sept. 25. Updates of state and county statistics start Sept. 26.
Regular annual updates enable the U.S. Bureau of Economic Analysis to refine our estimates as more complete source data become available. They are also a time to bring in improvements in methodology and presentation. This year, we'll introduce data on business investment in data centers.
Principal Federal Economic Indicators
Noteworthy
The Latest
BEA Releases New Health Care Statistics for 2014
The Bureau of Economic Analysis released a new set of statistics detailing how much the United States spends to treat different diseases and medical conditions.
Statistics on the Activities of U.S. Affiliates of Foreign Multinational Enterprises Now Available for 2015; Revised Data Available for 2014
Statistics detailing the activities of U.S. affiliates of foreign multinational enterprises (MNEs) are now available from the U.S. Bureau of Economic Analysis. The statistics, which provide new data for 2015, as well as revised data for 2014, offer details on the activities of U.S.
Gross Domestic Product for American Samoa, 2016
This release is available as a PDF download.
American Samoa GDP Turns Down in 2016
The Bureau of Economic Analysis released estimates of gross domestic product for American Samoa for 2016 as well as estimates of GDP by industry and compensation by industry for 2015. These estimates were developed under the Statistical Improvement Program funded by the Office of Insular Affairs of the U.S. Department of the Interior.
Revised estimates of GDP for 2013 to 2015 and revised estimates of GDP by industry and…
U.S. International Trade in Goods and Services, June 2017
Total June exports of $194.4 billion and imports of $238.0 billion resulted in a goods and services deficit of $43.6 billion.
June 2017 Trade Gap is $43.6 Billion
The U.S. monthly international trade deficit decreased in June 2017 according to the U.S. Bureau of Economic Analysis and the U.S. Census Bureau. The deficit decreased from $46.4 billion in May (revised) to $43.6 billion in June, as exports increased and imports decreased. The previously published May deficit was $46.5 billion. The goods deficit decreased $2.1 billion in June to $65.2 billion. The services surplus increased $0.6 billion in…
More than Just GDP: An Overview of BEA Statistics
Gross domestic product is BEA’s flagship statistic, the one people are most likely to know. But we produce lots of other data in addition to the nation’s GDP. You can get a quick overview by exploring BEA’s four main types of economic accounts: regional, national, international and industry.
An easy way to do that is to look through each area’s interactive data tables (tables that can be customized to show the statistics that interest…
Real Disposable Personal Income Declines in June
Personal income was unchanged in June after increasing 0.3 percent in May. Wages and salaries, the largest component of personal income, increased 0.4 percent in June after increasing 0.1 percent in May.
Personal Income and Outlays, June 2017; Annual Update 2014 through May 2017
In June 2017, real disposable personal income decreased 0.1 percent.
GDP Increases in Second Quarter
Real gross domestic product (GDP) increased 2.6 percent in the second quarter of 2017, according to the “advance” estimate released by the Bureau of Economic Analysis. In the first quarter, real GDP increased 1.2 percent (revised).


