
Bureau of Economic Analysis
U.S. International Transactions, 2nd Quarter 2025
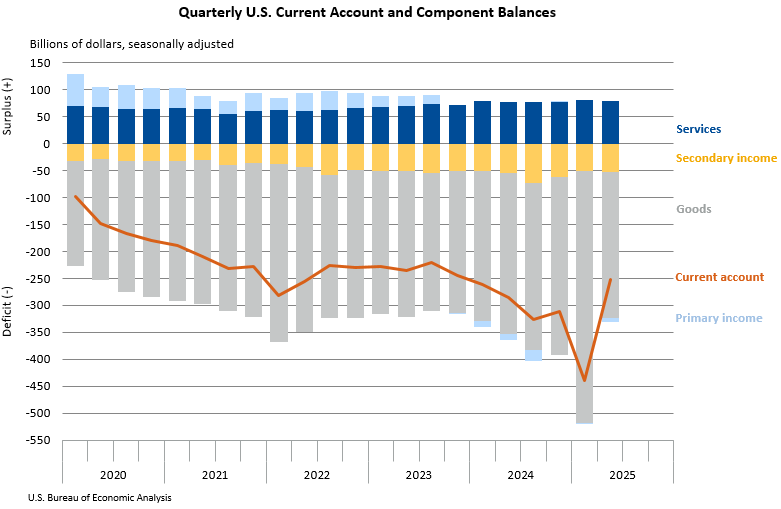
The U.S. current-account deficit narrowed by $188.5 billion, or 42.9 percent, to $251.3 billion in the second quarter of 2025, according to statistics released today by BEA. The revised first-quarter deficit was $439.8 billion. The second-quarter deficit was 3.3 percent of current-dollar gross domestic product, down from 5.9 percent in the first quarter.
Principal Federal Economic Indicators
Noteworthy


The Latest
GDP Increases in Second Quarter
Real gross domestic product (GDP) increased 2.6 percent in the second quarter of 2017, according to the “advance” estimate released by the Bureau of Economic Analysis. In the first quarter, real GDP increased 1.2 percent (revised).
Gross Domestic Product, 2nd quarter 2017 (advance estimate), and annual update
Real gross domestic product increased at an annual rate of 2.6 percent in the second quarter of 2017 (table 1), according to the "advance" estimate released by the Bureau of Economic Analysis. In the first quarter, real GDP increased 1.2 percent (revised). The Bureau emphasized that the second-quarter advance estimate released today is based on source data that are incomplete or subject to further revision by the source agency (see “Source…
Gross Domestic Product by State: First Quarter of 2017
Real gross domestic product (GDP) increased in 43 states and the District of Columbia in the first quarter of 2017, according to statistics on the geographic breakout of GDP released today by the U.S. Bureau of Economic Analysis. Real GDP by state growth ranged from 3.9 percent in Texas to –4.0 percent in Nebraska. Real estate and rental and leasing; mining; and durable-goods manufacturing were the leading contributors to U.S. economic growth…
Gross Domestic Product by State, 1st quarter 2017
Real gross domestic product (GDP) increased in 43 states and the District of Columbia in the first quarter of 2017. Real GDP by state growth in the first quarter ranged from 3.9 percent in Texas to -4.0 percent in Nebraska.
Detailed Direct Investment Data for 2016 Now Available
Detailed statistics on U.S. direct investment abroad – or “outward direct investment”– and on foreign direct investment in the United States – or “inward direct investment” – are now available on BEA’s website.
Real Estate and Rental and Leasing Led Growth in the First Quarter
Real estate and rental and leasing; mining; and durable goods manufacturing were the leading contributors to the increase in U.S. economic growth in the first quarter of 2017. Overall, 13 of 22 industry groups contributed to the 1.4 percent increase in real GDP in the first quarter.
Gross Domestic Product by Industry, 1st quarter 2017
Real estate and rental and leasing; mining; and durable goods manufacturing were the leading contributors to the increase in U.S. economic growth in the first quarter of 2017. According to gross domestic product (GDP) by industry statistics released by the Bureau of Economic Analysis, 13 of 22 industry groups contributed to the overall 1.4 percent increase in real GDP in the first quarter.
June 2017
Upcoming in the Survey... Annual Update of the International Economic Accounts. A summary of the major sources of the revisions to these accounts for 2013–2016. Direct Investment Positions by Country and by Industry. A more detailed look at inward and outward direct investment in 2016. International Investment Position. A look at the positions at the end of 2016 and the first quarter of 2017. U.S.
New Foreign Direct Investment in the United States, 2014-2016
Expenditures by foreign direct investors to acquire, establish, or expand U.S. businesses were $373.4 billion in 2016, down $66.2 billion, or 15 percent, from $439.6 billion in 2015.
Expenditures by Foreign Direct Investors for New Investment in the United States, 2014 – 2016
Expenditures by foreign direct investors to acquire, establish, or expand U.S. businesses totaled $373.4 billion in 2016. Spending was down 15 percent from $439.6 billion in 2015, but was above the annual average of $350.0 billion for 2014-2015, and was well above the annual average of $226.0 billion for 2006-2008. As in previous years, expenditures to acquire existing businesses accounted for a large majority of the total.