
Bureau of Economic Analysis
U.S. International Transactions, 2nd Quarter 2025
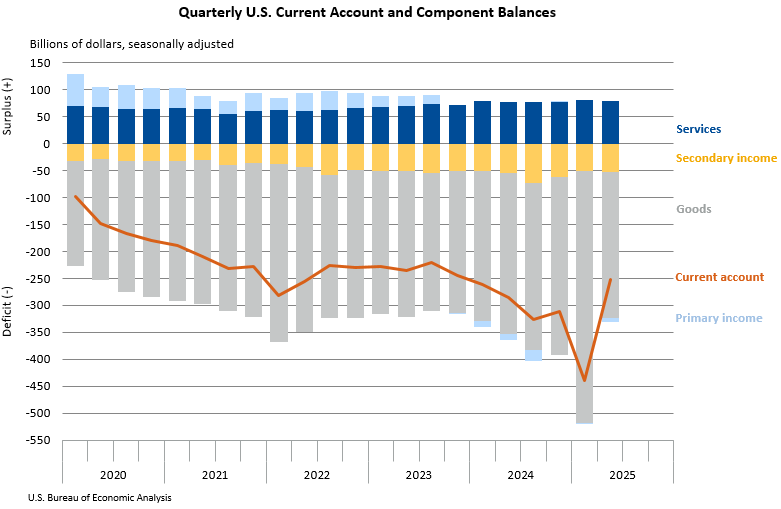
The U.S. current-account deficit narrowed by $188.5 billion, or 42.9 percent, to $251.3 billion in the second quarter of 2025, according to statistics released today by BEA. The revised first-quarter deficit was $439.8 billion. The second-quarter deficit was 3.3 percent of current-dollar gross domestic product, down from 5.9 percent in the first quarter.
Principal Federal Economic Indicators
Noteworthy


The Latest
U.S. Net International Investment Position Year 2016
The U.S. net international investment position decreased to −$8,318.4 billion (revised) at the end of 2016 from −$7,493.5 billion (revised) at the end of 2015.
U.S. International Investment Position, 1st quarter 2017, Year 2016, and annual update
ERRATA Table 1 and relevant text in the "U.S. Net International Investment Position: First Quarter 2017, Year 2016, and Annual Update" news release and corresponding statistics in the Interactive Tables were corrected on July 5, 2017. The corrections affect statistics for portfolio investment long-term debt liabilities and related aggregate statistics for the first quarter of 2017. Related financial transactions statistics were…
State Personal Income, First Quarter 2017
State personal income growth accelerated to 1.0 percent on average in the first quarter of 2017 from 0.3 percent in the fourth quarter of 2016. Earnings and personal current transfer receipts were the leading contributors to growth for the nation and in most states.
State Quarterly Personal Income, 1st quarter 2017
State personal income growth accelerated to 1.0 percent on average in the first quarter of 2017 from 0.3 percent in the fourth quarter of 2016, according to estimates released today by the Bureau of Economic Analysis (table 1). Earnings and personal current transfer receipts were the leading contributors to growth for the nation and in most states (table 2).
State Personal Income, First Quarter 2017
Real spending (output) on travel and tourism turned up in the first quarter of 2017, increasing at an annual rate of 0.4 percent after decreasing 2.7 percent (revised) in the fourth quarter of 2016, according to new statistics released by the Bureau of Economic Analysis. In contrast, real gross domestic product (GDP) for the nation decelerated, increasing 1.2 percent in the first quarter (second estimate) after increasing 2.1 percent in the…
Travel and Tourism Spending Turned Up in the First Quarter
Real spending (output) on travel and tourism turned up in the first quarter of 2017, increasing at an annual rate of 0.4 percent after decreasing 2.7 percent (revised) in the fourth quarter of 2016, according to new statistics released by the Bureau of Economic Analysis. In contrast, real gross domestic product (GDP) for the nation decelerated, increasing 1.2 percent in the first quarter (second estimate) after increasing 2.1 percent in the…
Travel and Tourism Satellite Accounts, 1st quarter 2017
Real spending (output) on travel and tourism turned up in the first quarter of 2017, increasing at an annual rate of 0.4 percent after decreasing 2.7 percent (revised) in the fourth quarter of 2016, according to new statistics released by the Bureau of Economic Analysis. In contrast, real gross domestic product (GDP) for the nation decelerated, increasing 1.2 percent in the first quarter (second estimate) after increasing 2.1 percent in the…
Real Personal Income for Metropolitan Areas, 2015
Growth of real personal income for metropolitan areas — an area’s current-dollar personal income adjusted by its regional price parity (RPP) and the national personal consumption expenditure (PCE) price index — ranged from -10.1 percent in Midland, TX to 9.9 percent in Carson City, NV.
Real Personal Income for States, 2015
Growth of real state personal income — a state’s current-dollar personal income adjusted by the state’sregional price parity (RPP) and the national personal consumption expenditure (PCE) price index —ranged from -2.3 percent in North Dakota to 7.0 percent in Delaware.
Real Personal Income for States and Metropolitan Areas, 2015
Real state personal income grew on average 4.1 percent in 2015, after increasing 3.6 percent in 2014. Growth of real state personal income ranged from -2.3 percent in North Dakota to 7.0 percent in Delaware. Across metropolitan areas, growth ranged from -10.1 percent in Midland, TX to 9.9 percent in Carson City, NV.