
Bureau of Economic Analysis
U.S. International Transactions and Investment Position, 1st Quarter 2026 and Annual Update
U.S. International Transactions
| Current-Account Balance | |
|---|---|
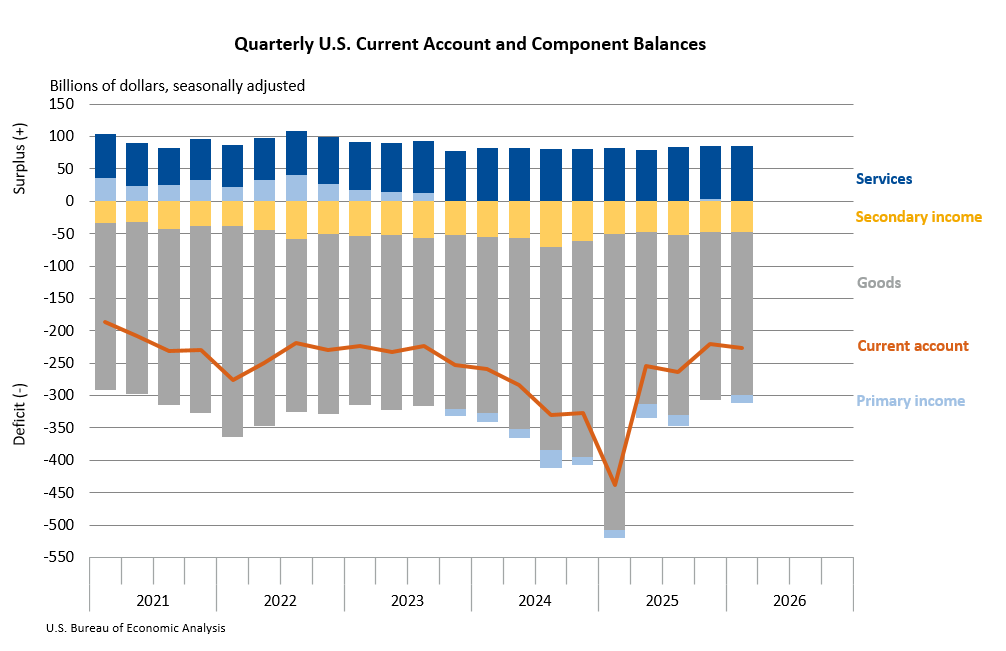
Q1 2026 | -$226.8 B |
Q4 2025 | -$221.1 B |
The U.S. current-account deficit resulting from international economic transactions widened by $5.8 billion, or 2.6 percent, to $226.8 billion in the first quarter of 2026, according to statistics released today by the U.S. Bureau of Economic Analysis. The revised fourth-quarter deficit was $221.1 billion. The first-quarter deficit was 2.9 percent of current-dollar gross domestic product, up from 2.8 percent in the fourth quarter.
U.S. International Investment Position
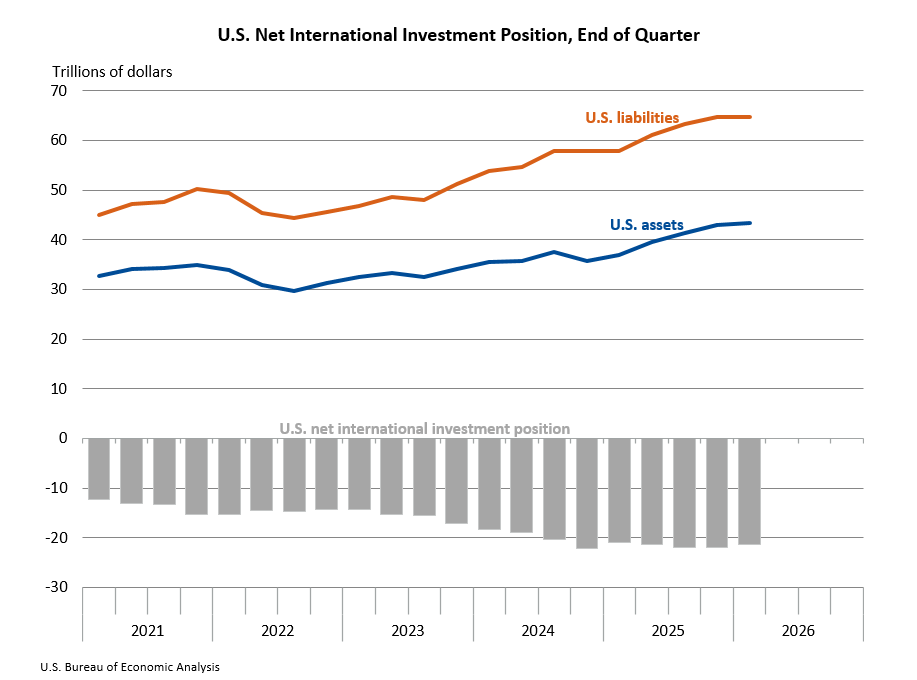
End of Q1 2026 | -$21.27 T |
End of Q4 2025 | -$21.87 T |
The U.S. net international investment position, the difference between U.S. residents’ foreign financial assets and liabilities, was –$21.27 trillion at the end of the first quarter of 2026. Assets totaled $43.37 trillion, and liabilities totaled $64.64 trillion. At the end of the fourth quarter of 2025, the net investment position was –$21.87 trillion (revised).
- Current Release: June 24, 2026
Next Release: September 24, 2026
Principal Federal Economic Indicators
Noteworthy


The Latest
U.S. International Transactions and Investment Position, 1st Quarter 2026 and Annual Update
The U.S. current-account deficit resulting from international economic transactions widened by $5.8 billion, or 2.6 percent, to $226.8 billion in the first quarter of 2026, according to statistics released today by the U.S. Bureau of Economic Analysis. The revised fourth-quarter deficit was $221.1 billion. The first-quarter deficit was 2.9 percent of current-dollar gross domestic product, up from 2.8 percent in the fourth quarter.
Innovations in Distribution of Income Statistics: New Data and a New Tool
Build custom tables and charts from BEA's distribution of personal income statistics with BEA’s newest data analysis tool.
Advancing Measurement and Understanding of AI’s Economic Impact
A blog post from BEA Director Vipin Arora
I’m sure many of us remember playing the “don’t say it” game. Someone picks a word to avoid, and the first person to utter that word loses. Can you imagine how quickly the game would end these days if the word was AI?
New Foreign Direct Investment in the United States, 2025
Expenditures by foreign direct investors to acquire, establish, or expand U.S. businesses totaled $232.2 billion in 2025, according to preliminary statistics released today by the U.S. Bureau of Economic Analysis. Expenditures increased $76.8 billion, or 49.5 percent, from 2024 levels. As in previous years, acquisitions of existing U.S. businesses accounted for most of the expenditures.
U.S. International Trade in Goods and Services, April 2026
The U.S. monthly international trade deficit decreased in April 2026 according to the U.S. Bureau of Economic Analysis and the U.S. Census Bureau. The deficit decreased from $56.6 billion in March (revised) to $55.9 billion in April, as exports increased more than imports. The goods deficit decreased $2.4 billion in April to $83.7 billion. The services surplus decreased $1.7 billion in April to $27.8 billion.
U.S. International Trade in Goods and Services, Annual Revision
In this release and in the accompanying “U.S. International Trade in Goods and Services, April 2026” release (FT–900), the U.S. Census Bureau and the U.S. Bureau of Economic Analysis (BEA) are publishing revised statistics on trade in goods and services. With these releases, statistics on trade in goods are revised beginning with 2021, and statistics on trade in services are revised beginning with 1999.
How Does AI Drive Growth? Explore Our Integrated Industry-Level Production Stats
A blog post from BEA Director Vipin Arora
When my kids were younger, they always asked me how things are made. I usually didn’t know. My own dad’s playbook for these questions was saying “I forgot.” I guess I’ve forgotten a lot over the years, too. That said, understanding how things are made is critical to making them better, and ultimately to driving economic growth.
Need Intel on the U.S. Capacity to Produce? Check Out Our Fixed Assets Data
A blog post from BEA Director Vipin Arora
It still seems novel to me that the United States is the world’s largest producer of crude oil, though we’ve had that distinction since 2018. And my guess is that even in the eternally optimistic oil business, there weren’t many people who predicted this back when the shale boom began gathering momentum. In fact, I remember claims at the time that even with new fracking technology,…
GDP (Second Estimate) and Corporate Profits, 1st Quarter 2026
Real gross domestic product (GDP) increased at an annual rate of 1.6 percent in the first quarter of 2026 (January, February, and March), according to the second estimate released today by the U.S. Bureau of Economic Analysis. In the fourth quarter of 2025, real GDP increased 0.5 percent. The contributors to the increase in real GDP in the first quarter were exports, investment, consumer spending, and government spending. Imports, which are a…
Personal Income and Outlays, April 2026
Personal income decreased less than $0.1 billion (less than 0.1 percent at a monthly rate) in April, according to estimates released today by the U.S. Bureau of Economic Analysis (BEA). Disposable personal income (DPI)—personal income less personal current taxes—decreased $19.9 billion (0.1 percent), and personal consumption expenditures (PCE) increased $111.1 billion (0.5 percent). Personal outlays—the sum of PCE, personal interest payments,…