Bureau of Economic Analysis
Annual Update of GDP, Industry, and State Statistics Starts Sept. 25
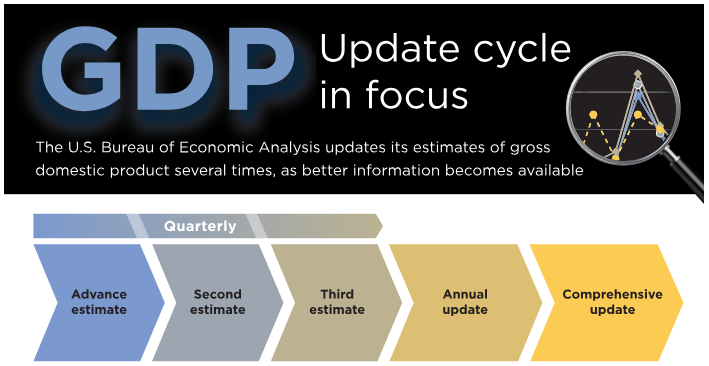
Release of the annual update of gross domestic product and related statistics, including GDP by industry, begins Sept. 25. Updates of state and county statistics start Sept. 26.
Regular annual updates enable the U.S. Bureau of Economic Analysis to refine our estimates as more complete source data become available. They are also a time to bring in improvements in methodology and presentation. This year, we'll introduce data on business investment in data centers.
Principal Federal Economic Indicators
Noteworthy
The Latest
President's Budget Backs BEA Efforts to Provide New and Improved Economic Data
As the fictional great detective Sherlock Holmes put it, and former Federal Reserve Chairman Ben Bernanke has quoted: “It is a capital mistake to theorize before one has data.”
In the case of business leaders, households, and policymakers, those data frequently come from the U.S. Bureau of Economic Analysis. Several initiatives contained in President Barack Obama’s recently unveiled budget for fiscal year 2017 would enable BEA to…
Arts and Culture Grow at Faster Pace as BEA Takes its First Inflation-Adjusted Look
Arts and cultural economic activity, adjusted for inflation, grew 2.5 percent in 2013, according to estimates of the industries’ real value added by the Bureau of Economic Analysis. That compares with a 1.1 percent increase in 2012.
Information services and design services were the leading contributors to the growth in 2013. Overall, 26 of 36 arts and culture-related industries contributed to the increase. As a group, the core arts…
Innovation @ BEA: Exploring New Data Projects
BEA is working on a variety of projects this year to bring new economic statistics your way. The goal is to give business people, policymakers and households additional tools to make informed decisions and deepen their understanding of the U.S. economy.
2015 Trade Gap is $531.5 Billion
The U.S. international trade deficit increased in 2015 according to the U.S. Bureau of Economic Analysis and the U.S. Census Bureau. The deficit increased from $508.3 billion in 2014 to $531.5 billion in 2015, as exports decreased more than imports. As a percentage of U.S. gross domestic product, the goods and services deficit was 3.0 percent in 2015, up from 2.9 percent in 2014. The goods deficit increased from $741.5 billion in 2014 to $758…
December 2015 Trade Gap is $43.4 Billion
The U.S. monthly international trade deficit increased in December 2015 according to the U.S. Bureau of Economic Analysis and the U.S. Census Bureau. The deficit increased from $42.2 billion in November (revised) to $43.4 billion in December, as exports decreased and imports increased. The previously published November deficit was $42.4 billion. The goods deficit increased $1.3 billion from November to $62.5 billion in December. The services…
U.S. International Trade in Goods and Services, December 2015
U.S. Census Bureau U.S. Bureau of Economic Analysis NEWS U.S. Department of Commerce * Washington, DC 20230 U.S. INTERNATIONAL TRADE IN GOODS AND SERVICES December 2015 The U.S. Census Bureau and the U.S.
Real Disposable Income Rises in December
Personal income increased 0.3 percent in December, the same increase as in November. Wages and salaries, the largest component of personal income, increased 0.2 percent in December after increasing 0.5 percent in November.
Personal Income and Outlays, December 2015
Personal income increased $42.5 billion, or 0.3 percent, and disposable personal income (DPI) increased $37.8 billion, or 0.3 percent, in December, according to the Bureau of Economic Analysis. Personal consumption expenditures (PCE) decreased $0.7 billion, or less than 0.1 percent.
GDP Increases in Fourth Quarter
Real gross domestic product (GDP) increased 0.7 percent in the fourth quarter of 2015, according to the “advance” estimate released by the Bureau of Economic Analysis. In the third quarter, real GDP increased 2.0 percent.
GDP highlights


