Bureau of Economic Analysis
Annual Update of GDP, Industry, and State Statistics Starts Sept. 25
Release of the annual update of gross domestic product and related statistics, including GDP by industry, begins Sept. 25. Updates of state and county statistics start Sept. 26.
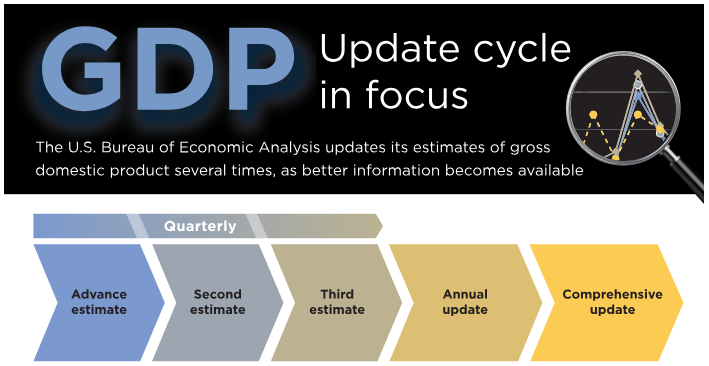
Regular annual updates enable the U.S. Bureau of Economic Analysis to refine our estimates as more complete source data become available. They are also a time to bring in improvements in methodology and presentation. This year, we'll introduce data on business investment in data centers.
Principal Federal Economic Indicators
Noteworthy
The Latest
Gross Domestic Product for U.S. Virgin Islands (USVI), 2014
This release is available as a PDF download.
Travel and Tourism Satellite Accounts, 3rd quarter 2015
Real spending (output) on travel and tourism decelerated in the third quarter of 2015, increasing at an annual rate of 4.3 percent after increasing 8.4 percent (revised) in the second quarter of 2015. Real gross domestic product (GDP) also decelerated, increasing 2.1 percent (second estimate) in the third quarter after increasing 3.9 percent.
Second Quarter Growth in Service Industries Widespread Across States
Real gross domestic product (GDP) increased in 46 states and the District of Columbia in the second quarter of 2015. Overall, U.S. real GDP by state grew at an annual rate of 3.8 percent in the second quarter of 2015 after increasing 0.7 percent in the first quarter of 2015. Finance and insurance; professional, scientific, and technical services; and wholesale trade were the leading contributors to real U.S. economic growth in the second…
Gross Domestic Product by State, 2nd Quarter 2015
Today, the U.S. Bureau of Economic Analysis (BEA) released–for the first time–gross domestic product (GDP) by state for 21 industry sectors on a quarterly basis.1 These new statistics supplement BEA's national quarterly GDP by industry statistics first released in April 2014. These new data provide timely information on how specific industries contribute to accelerations, decelerations, and turning points in economic growth at the state level…
GDP by State Statistics for Second Quarter of 2015 to be Released December 10
New statistics on the economic performance of all 50 states and the District of Columbia during the second quarter of 2015 will be released Thursday, Dec. 10 at 8:30 a.m. eastern time by the U.S. Bureau of Economic Analysis.
October 2015 Trade Gap is $43.9 Billion
The U.S. monthly international trade deficit increased in October 2015 according to the U.S. Bureau of Economic Analysis and the U.S. Census Bureau. The deficit increased from $42.5 billion in September (revised) to $43.9 billion in October, as exports decreased more than imports. The previously published September deficit was $40.8 billion. The goods deficit increased $2.1 billion from September to $63.1 billion in October. The…
U.S. International Trade in Goods and Services, October 2015
U.S. Census Bureau U.S. Bureau of Economic Analysis NEWS U.S. Department of Commerce * Washington, DC 20230 U.S. INTERNATIONAL TRADE IN GOODS AND SERVICES OCTOBER 2015 The U.S. Census Bureau and the U.S.
Guest Blog: U.S. Remains No. 1 Choice for Foreign Investment – New Stats Released
This is a guest blog by Vinai Thummalapally, Executive Director of SelectUSA.
On Monday, the Bureau of Economic Analysis (BEA) released highly-anticipated data highlighting new foreign direct investment (FDI) expenditures in the United States.
Bureau of Economic Analysis Releases Two New Data Sets to Deepen Understanding of U.S. Economy
In the past two days, the Commerce Department’s Bureau of Economic Analysis (BEA) has released two brand new sets of economic statistics that business people, entrepreneurs, policy makers, households and others can use to make more informed decisions in their professional and personal lives.
Guam's Economy Grew 1 Percent in 2014
Guam’s real gross domestic product — adjusted to remove price changes — increased 1 percent in 2014. For comparison, economic growth for the United States (excluding the territories) increased 2.4 percent during the same period.
Growth in Guam was widespread among the components of GDP and included increases in private fixed investment, government spending and consumer spending. Growth in these components was partly…


