Bureau of Economic Analysis
U.S. International Trade in Goods and Services, July 2025
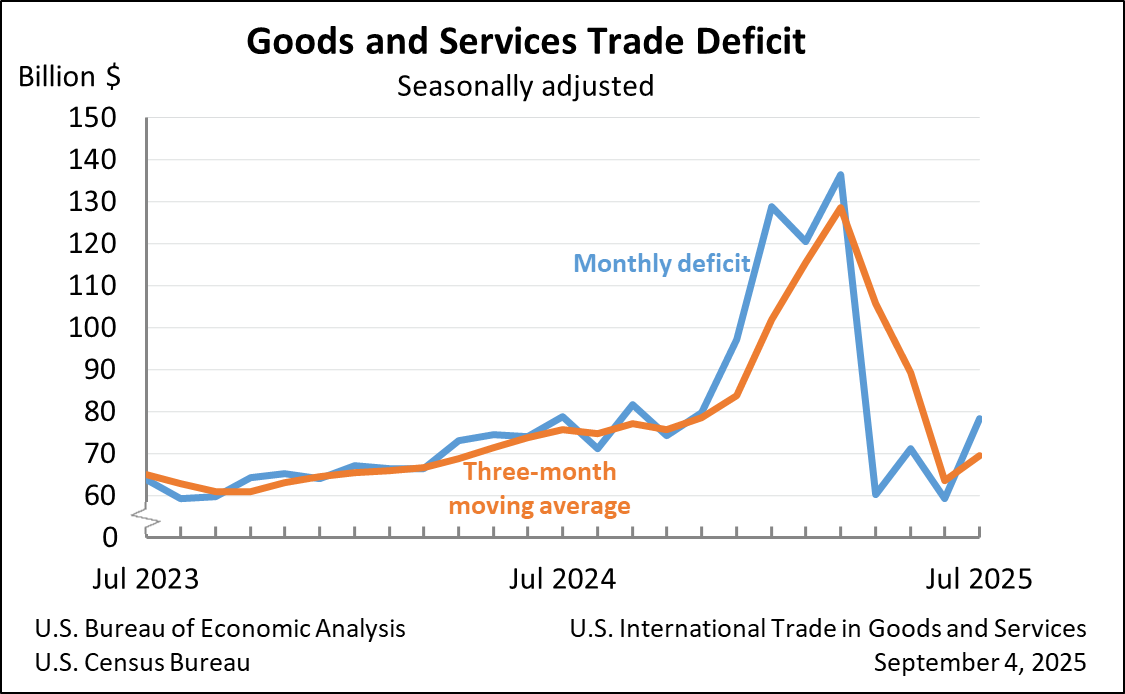
The U.S. goods and services trade deficit increased in July 2025 according to the U.S. Bureau of Economic Analysis and the U.S. Census Bureau. The deficit increased from $59.1 billion in June (revised) to $78.3 billion in July, as imports increased more than exports. The goods deficit increased $18.2 billion in July to $103.9 billion. The services surplus decreased $1.1 billion in July to $25.6 billion.
Principal Federal Economic Indicators
Noteworthy
The Latest
Personal Consumption Expenditures by State, 1997-2014
Today, the U.S. Bureau of Economic Analysis released its first set of official statistics on personal consumption expenditures (PCE) by state for 1997-20141. PCE by state – the measure of goods and services purchased by or on behalf of households by state of residence – provides insight into household spending patterns across states and can be used together with other regional data to gain a better understanding of regional economies.
New Statistics Detailing New Investment in the United States by Foreign Direct Investors Are Now Available
Statistics detailing the amount and type of new investment made in the United States by foreign direct investors to acquire, establish, or expand U.S. businesses are now available from the Bureau of Economic Analysis. The statistics cover new investments initiated in 2014 and offer details on these investments, including the countries from which the new investment originates, the U.S. industries that are drawing new investments, and U.S.…
New Foreign Direct Investment in the United States, 2014
Expenditures by foreign direct investors for new investment—that is, to acquire, establish, or expand U.S. businesses—totaled $241.3 billion in 2014, according to the Bureau of Economic Analysis (BEA) in statistics released today. Acquisitions accounted for most of the investment.
BEA to Release New Statistics Detailing Consumer Spending in Every State for 2014
New statistics detailing consumer spending by state will be released Tuesday, Dec. 1 at 8:30 a.m. eastern time by the U.S. Bureau of Economic Analysis.
Personal Income Increases in October
Personal income increased 0.4 percent in October, after increasing 0.2 percent in September. Wages and salaries, the largest component of personal income increased 0.6 percent in October after remaining flat in September.
Current-dollar disposable personal income (DPI), after-tax income, increased 0.4 percent in October after increasing 0.2 percent in September.
Real DPI, income adjusted for taxes and inflation…
Personal Income and Outlays, October 2015
Personal income increased $68.1 billion, or 0.4 percent, and disposable personal income (DPI) increased $56.8 billion, or 0.4 percent, in October, according to the Bureau of Economic Analysis. Personal consumption expenditures (PCE) increased $15.2 billion, or 0.1 percent.
GDP Growth Rate Revised Up
Real gross domestic product (GDP) increased 2.1 percent in the third quarter of 2015, according to the “second” estimate released by the Bureau of Economic Analysis. The growth rate was revised up 0.6 percentage point from the “advance” estimate released in October. In the second quarter, real GDP increased 3.9 percent.
GDP highlights The third-quarter increase in real GDP mainly reflected a rise in consumer spending. Spending on…
Gross Domestic Product, 3rd quarter 2015 (second estimate); Corporate Profits, 3rd quarter 2015 (preliminary estimate)
Real gross domestic product -- the value of the goods and services produced by the nation’s economy less the value of the goods and services used up in production, adjusted for price changes -- increased at an annual rate of 2.1 percent in the third quarter of 2015, according to the "second" estimate released by the Bureau of Economic Analysis. In the second quarter, real GDP increased 3.9 percent. The GDP estimate released today…
BEA's New and Existing Statistics Offer Economic Intel for Entrepreneurs and Business Community
What are consumer spending patterns in California compared to New York? Which states are attracting new foreign investment? How are different industries in each state performing on a quarterly basis? Those are just a few examples of the kinds of new statistics that the Bureau of Economic Analysis (BEA) is producing to give entrepreneurs even more economic intelligence as they chart strategies on marketing, investing, and hiring.…
BEA to Release New Statistics Detailing New Foreign Direct Investment in the United States on Nov. 30
WASHINGTON – New statistics detailing the amount and type of new direct investment made in the United States by foreign investors will be released by the Bureau of Economic Analysis on Monday, Nov. 30.
The data will be available in a news release on BEA’s website at 8:30 a.m. eastern time. The statistics cover new direct investments initiated in 2014 and will provide information on:


