Bureau of Economic Analysis
Annual Update of GDP, Industry, and State Statistics Starts Sept. 25
Release of the annual update of gross domestic product and related statistics, including GDP by industry, begins Sept. 25. Updates of state and county statistics start Sept. 26.
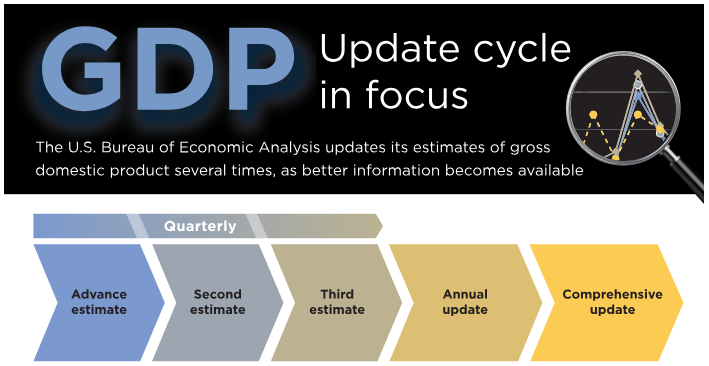
Regular annual updates enable the U.S. Bureau of Economic Analysis to refine our estimates as more complete source data become available. They are also a time to bring in improvements in methodology and presentation. This year, we'll introduce data on business investment in data centers.
Principal Federal Economic Indicators
Noteworthy
The Latest
GDP Turns up in Second Quarter
Real gross domestic product (GDP) increased 4.6 percent in the second quarter of 2014, according to the “third” estimate released by the Bureau of Economic Analysis. The second-quarter growth rate was revised up 0.4 percentage point from the “second” estimate released in August. In the first quarter, real GDP decreased 2.1 percent.
Second-quarter highlights Exports of notably nondurable industrial supplies and materials and…
Gross Domestic Product, 2nd quarter 2014 (third estimate); Corporate Profits, 2nd quarter 2014 (revised estimate)
Real gross domestic product -- the output of goods and services produced by labor and property located in the United States -- increased at an annual rate of 4.6 percent in the second quarter of 2014, according to the "third" estimate released by the Bureau of Economic Analysis. In the first quarter, real GDP decreased 2.1 percent. The GDP estimate released today is based on more complete source data than were available for the "…
Value of Both U.S. Assets and U.S. Liabilities Increased in Second Quarter 2014
The U.S. net international investment position was -$5,445.1 billion (preliminary) at the end of the second quarter of 2014 as the value of U.S. liabilities exceeded the value of U.S. assets. At the end of the first quarter, the net position was -$5,511.7 billion (revised).
U.S. International Investment Position, 2nd quarter 2014
The U.S. net international investment position at the end of the second quarter of 2014 was -$5,445.1 billion (preliminary) as the value of U.S. liabilities exceeded the value of U.S. assets (chart 1, table 1). At the end of the first quarter of 2014, the net position was -$5,511.7 billion (revised). The $66.6 billion increase in the net position reflected a $913.2 billion increase in the value of U.S. assets and an $846.7 billion increase…
Travel and Tourism Spending Turned up in the Second Quarter of 2014
Real spending on travel and tourism turned up in the second quarter of 2014, increasing at an annual rate of 2.1 percent after decreasing 1.1 percent (revised) in the first quarter of 2014. Real gross domestic product (GDP) also experienced an upturn, increasing 4.2 percent (second estimate) in the second quarter after decreasing 2.1 percent in the first quarter. All major categories, with the exception of “traveler accommodations”…
Travel and Tourism Satellite Accounts, 2nd quarter 2014
Real spending on travel and tourism turned up in the second quarter of 2014, increasing at an annual rate of 2.1 percent after decreasing 1.1 percent (revised) in the first quarter of 2014. Real gross domestic product (GDP) also experienced an upturn, increasing 4.2 percent (second estimate) in the second quarter after decreasing 2.1 percent in the first quarter. All major categories, with the exception of “traveler accommodations”…
U.S. Current-Account Deficit Decreases in Second Quarter 2014
The U.S. current-account deficit-the combined balances on trade in goods and services, income, and net unilateral current transfers – decreased to $98.5 billion (preliminary) in the second quarter of 2014 from $102.1 billion (revised) in the first quarter of 2014. As a percentage of U.S. GDP, the deficit decreased to 2.3 percent from 2.4 percent. The previously published current-account deficit for the first quarter was $111.2 billion.
Second Quarter 2014 Travel and Tourism Spending Data to Be Released Sept. 18
Statistics on what Americans and foreigners spent on travel and tourism in the United States in the second quarter of 2014 will be released Thursday, Sept. 18 by the Bureau of Economic Analysis (BEA).
The statistics, part of BEA’s Travel and Tourism Satellite Accounts, provide a breakdown of the various components of travel and tourism spending, including lodging, meals, air travel, and shopping. The statistics will also provide data…
U.S. International Transactions, 2nd quarter 2014
Sarah P. Scott: (202) 606-9286 (Data)
U.S. International Transactions: Second Quarter 2014
Widespread Growth Across Metropolitan Areas
Real GDP increased in 292 of the nation’s 381 metropolitan areas in 2013, led by widespread growth in finance, insurance, real estate, rental, and leasing; nondurable-goods manufacturing; and professional and business services.


