Bureau of Economic Analysis
Gross Domestic Product by County and Personal Income by County, 2024
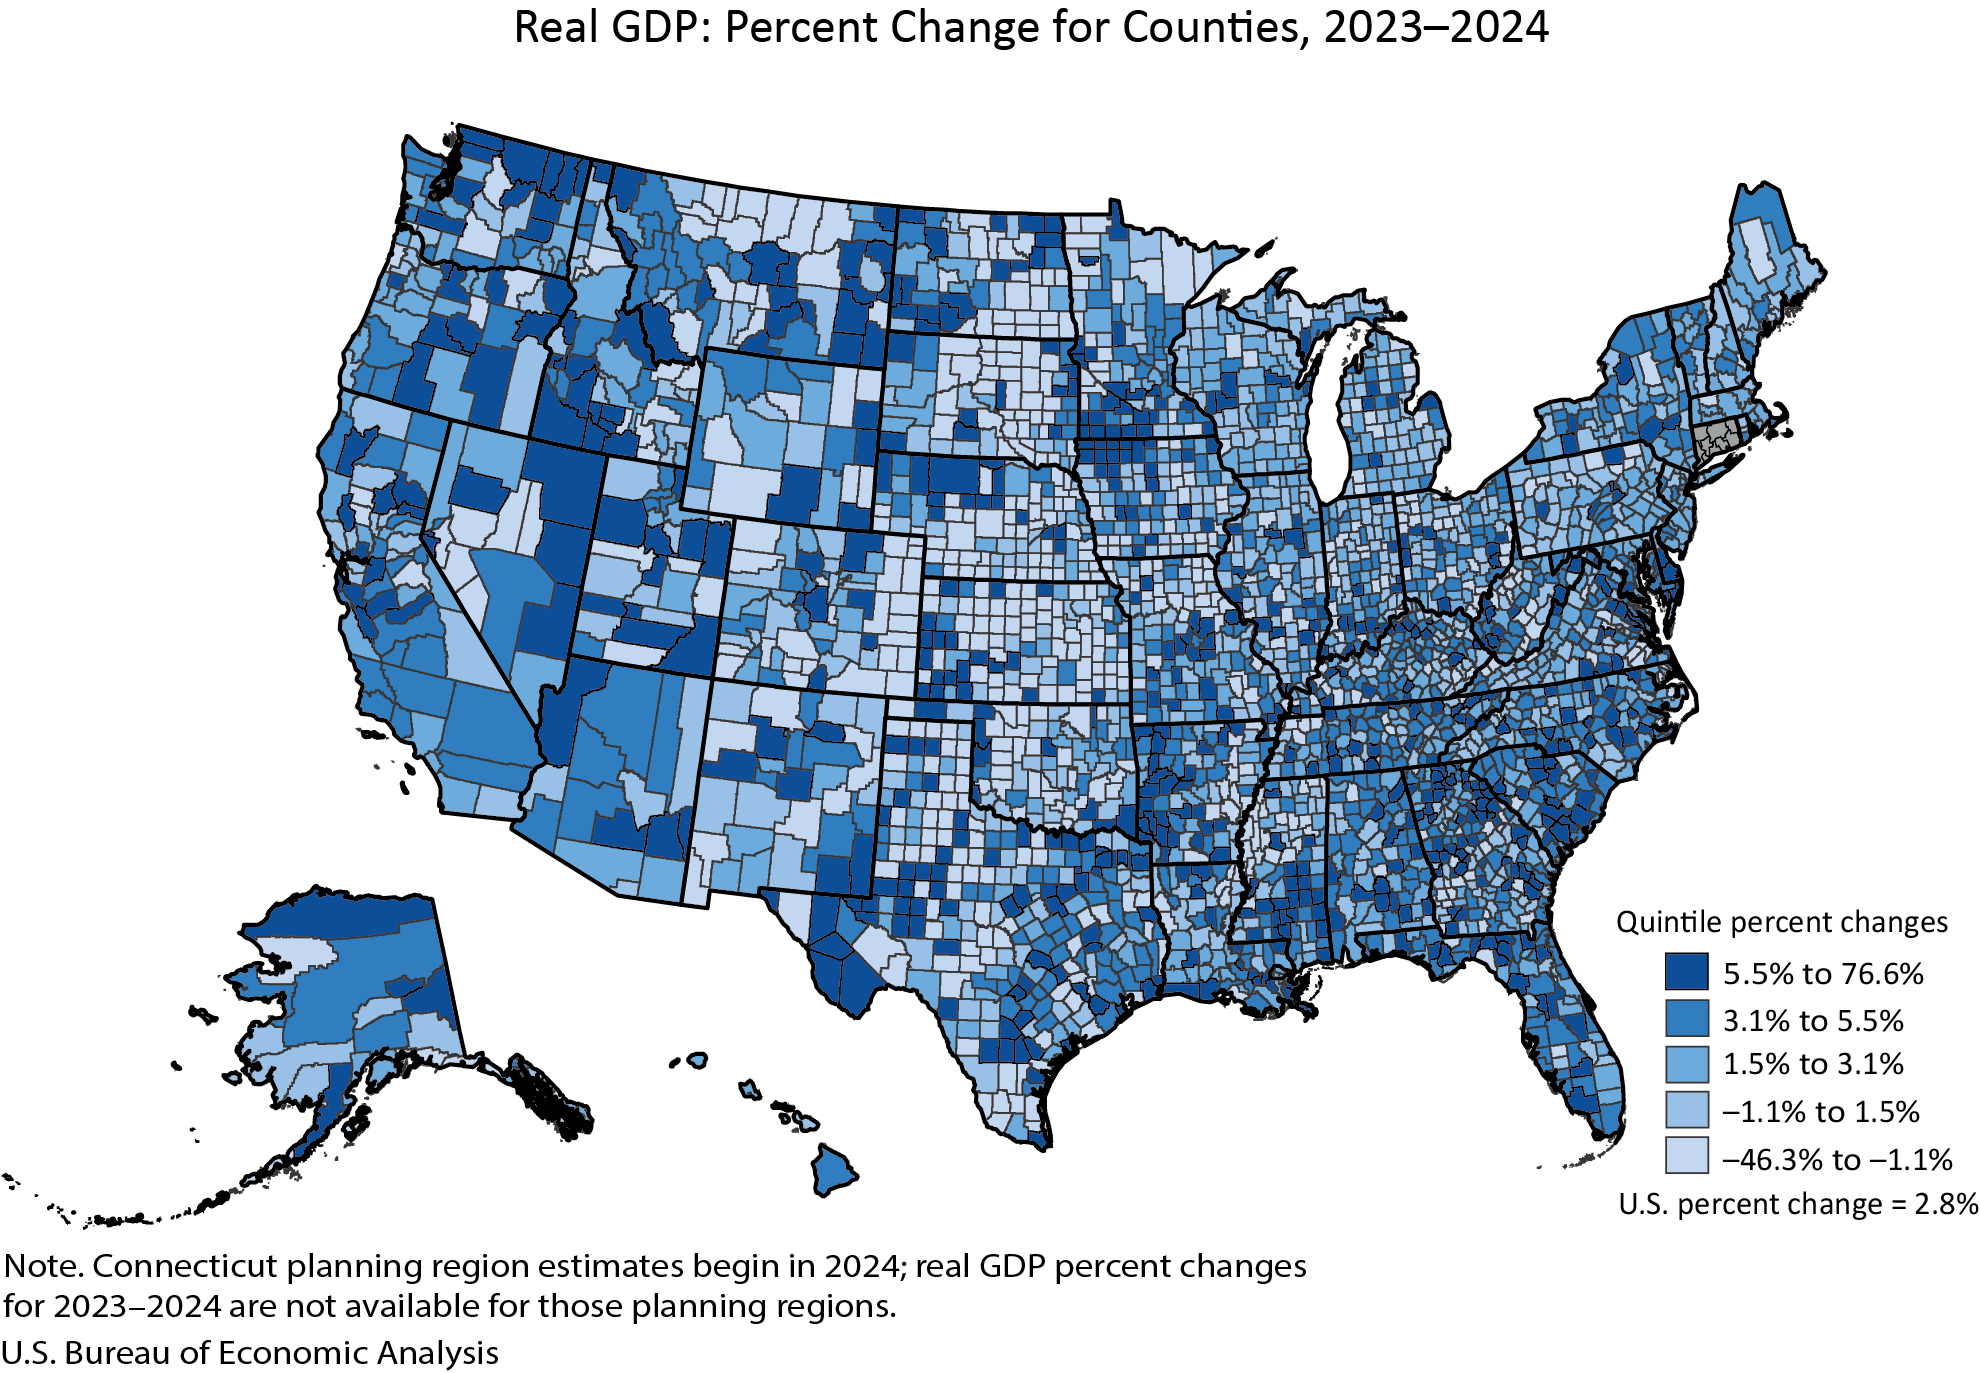
Real gross domestic product (GDP) increased in 2,273 counties, decreased in 809 counties, and was unchanged in 24 counties in 2024. County-level changes ranged from a 76.6 percent increase in Carter County, MT, to a 46.3 percent decline in Baca County, CO.
Personal income, in current dollars, increased in 2,768 counties, decreased in 331, and was unchanged in 7 counties in 2024. County-level changes ranged from a 22.6 percent increase in Harding County, SD, to a 23.3 percent decline in Issaquena County, MS.
Principal Federal Economic Indicators
Noteworthy
The Latest
Gross Domestic Product, 2nd quarter 2010 (second estimate); Corporate Profits, 2nd quarter 2010 (preliminary estimate)
Real gross domestic product -- the output of goods and services produced by labor and property located in the United States -- increased at an annual rate of 1.6 percent in the second quarter of 2010, (that is, from the first quarter to the second quarter), according to the "second" estimate released by the Bureau of Economic Analysis. In the first quarter, real GDP increased 3.7 percent. The GDP estimates released today are based on more…
Personal Income for Metropolitan Areas, 2009
WASHINGTON DC, August 9, 2010 – Personal income declined in 2009 in most of the nation's metropolitan statistical areas (MSAs), according to estimates released today by the U.S. Bureau of Economic Analysis. Personal income declined in 223 MSAs, increased in 134, and remained unchanged in 9 MSAs. On average, MSA personal income fell 1.8 percent in 2009, after rising 2.7 percent in 2008. Personal income growth ranged from 14 percent in…
Personal Income and Outlays, June 2010
Personal income increased $3.0 billion, or less than 0.1 percent, and disposable personal income (DPI) increased $5.1 billion, or less than 0.1 percent, inJune, according to the Bureau of Economic Analysis. Personal consumption expenditures (PCE) decreased $2.9 billion, or less than 0.1 percent. In May, personal income increased $40.5 billion, or 0.3 percent, DPI increased $36.9 billion, or 0.3 percent, and PCE increased $8.6 billion, or 0.1…
Gross Domestic Product, 2nd quarter 2010 (advance estimate)
Real gross domestic product -- the output of goods and services produced by labor and property located in the United States -- increased at an annual rate of 2.4 percent in the second quarter of 2010, (that is, from the first quarter to the second quarter), according to the "advance" estimate released by the Bureau of Economic Analysis.
Gross Domestic Product for the U.S. Virgin Islands
CHARLOTTE AMALIE, U.S. VIRGIN ISLANDS (July 6, 2010) Today, the Bureau of Economic Analysis (BEA) is releasing its first set of estimates of the major components of gross domestic product (GDP) for the U.S. Virgin Islands.1
Research and Development Satellite Account, 2010
Gross Domestic Product (GDP) would have been, on average, 2.7 percent, or $301.5 billion higher between 1998 and 2007 if research and development (R&D) spending was treated as investment in the U.S. national income and product accounts, the Bureau of Economic Analysis (BEA) announced today. The 2010 R&D Satellite Account updates and extends BEA’s estimates of the effect of R&D on economic growth through 2007, and now…
Personal Income and Outlays, May 2010
Personal income increased $53.7 billion, or 0.4 percent, and disposable personal income (DPI) increased $49.0 billion, or 0.4 percent, inMay, according to the Bureau of Economic Analysis. Personal consumption expenditures (PCE) increased $24.4 billion, or 0.2 percent. In April, personal income increased $59.4 billion, or 0.5 percent, DPI increased $63.7 billion, or 0.6 percent, and PCE increased $1.4 billion, or less than 0.1 percent, based…
Gross Domestic Product, 1st quarter 2010 (third estimate) | Corporate Profits, 1st quarter 2010 (revised estimate)
Real gross domestic product -- the output of goods and services produced by labor and property located in the United States -- increased at an annual rate of 2.7 percent in the first quarter of 2010, (that is, from the fourth quarter to the first quarter), according to the "third" estimate released by the Bureau of Economic Analysis. In the fourth quarter of 2009, real GDP increased 5.6 percent. The GDP estimate released today is…


