Bureau of Economic Analysis
Annual Update of GDP, Industry, and State Statistics Starts Sept. 25
Release of the annual update of gross domestic product and related statistics, including GDP by industry, begins Sept. 25. Updates of state and county statistics start Sept. 26.
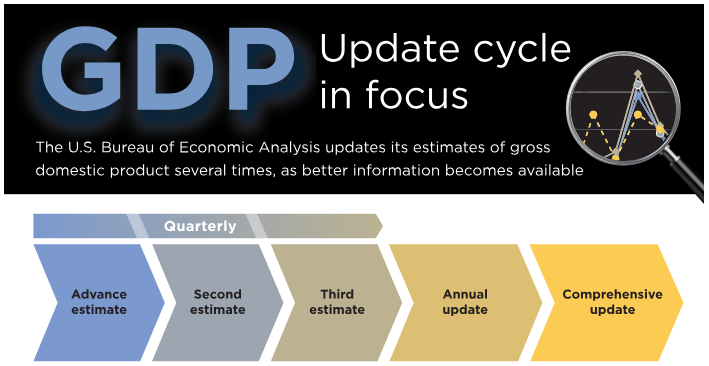
Regular annual updates enable the U.S. Bureau of Economic Analysis to refine our estimates as more complete source data become available. They are also a time to bring in improvements in methodology and presentation. This year, we'll introduce data on business investment in data centers.
Principal Federal Economic Indicators
Noteworthy
The Latest
Personal Income October 2003
NOTE: This release has not been updated to reflect the 2003 comprehensive revision.
Gross Domestic Product and Corporate Profits Third Quarter 2003 "preliminary" estimates
NOTE: This release has not been updated to reflect the 2003 comprehensive revision.
U.S. International Trade in Goods and Services: September 2003
The first two pages of this release are shown in plain text below.
Personal Income September 2003
The tables in this release are available in an XLS spreadsheet and the entire release is available in PDF format.
Gross Domestic Product Third Quarter 2003 "advance" estimates
The tables in this release are available in an XLS spreadsheet, and the entire release is available in PDF format.
State Personal Income: Second Quarter 2003
The tables in this release are available in an XLS spreadsheet and the entire release is available in PDF format.
U.S. International Trade in Goods and Services: August 2003
The first two pages of this release are shown in plain text below.
Capital Flows in the U.S. Economy, 1997
The Bureau of Economic Analysis (BEA) today releases the capital flow data for 1997, which show which industries purchase what types of equipment, software and structures. This table is the latest in a series of tables that provide detailed information on the flows of investment in the U.S. economy. The capital flow table is an important supplemental table to the 1997 benchmark input-output (I-O) accounts.
Personal Income August 2003
The tables in this release are available in an XLS spreadsheet and the entire release is available in PDF format.


