Bureau of Economic Analysis
Direct Investment by Country and Industry, 2024
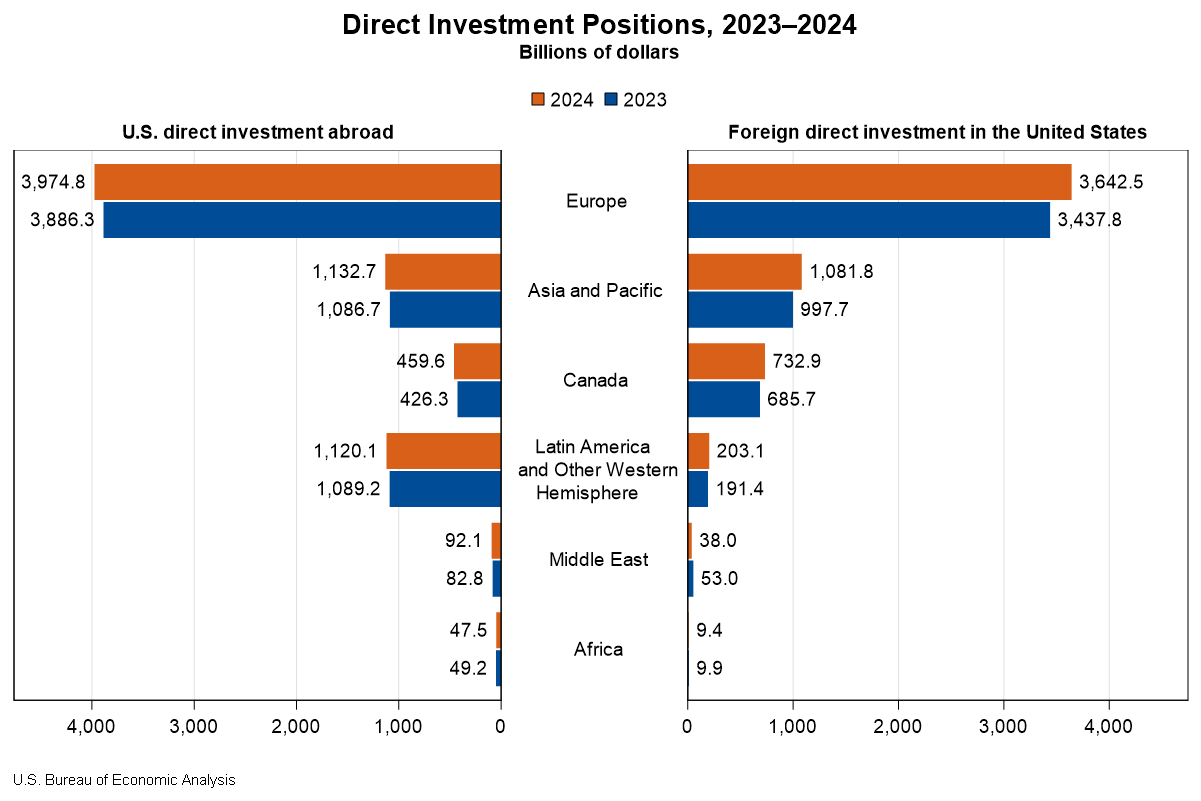
The U.S. direct investment abroad position, or cumulative level of investment, increased $206.3 billion to $6.83 trillion at the end of 2024, according to statistics released today by the U.S. Bureau of Economic Analysis. The increase was led by an $88.4 billion increase in the position in Europe, primarily in Luxembourg and Germany. By industry, manufacturing affiliates had the largest increase, led by manufacturing of computers and electronic products.
The foreign direct investment in the United States position increased $332.1 billion to $5.71 trillion at the end of 2024. The increase was led by a $204.7 billion increase in the position from Europe, which reflected a $52.9 billion increase from the United Kingdom and a $39.7 billion increase from Germany. By industry, affiliates in manufacturing increased the most.
Principal Federal Economic Indicators
Noteworthy
- 2025 News Release Schedule
- Innovation at BEA
- 2025 Annual Updates
- New! Services Trade Data for More Countries
- Data Tool: Trade in Value Added
- Distribution of State Personal Income
- Updated: RIMS II Regional Multipliers
- Arts and Culture
- Space Economy
- FDI Now in State BEARFACTS
- Quick Guide: Price Indexes
The Latest
Gross Domestic Product for the Commonwealth of the Northern Mariana Islands (CNMI), 2018
The estimates of GDP for the CNMI show that real GDP—GDP adjusted to remove price changes—decreased 19.6 percent in 2018 after increasing 25.5 percent in 2017 (see Table 1.3). For comparison, real GDP for the United States (excluding the territories) increased 2.9 percent in 2018 after increasing 2.4 percent in 2017.
Northern Mariana Islands GDP Decreases in 2018
The estimates of gross domestic product (GDP) for the Commonwealth of the Northern Mariana Islands (CNMI) show that real GDP—GDP adjusted to remove price changes—decreased 19.6 percent in 2018 after increasing 25.5 percent in 2017. For comparison, real GDP for the United States (excluding the territories) increased 2.9 percent in 2018 after increasing 2.4 percent in 2017.
September 2019 Trade Gap is $52.5 Billion
The U.S. monthly international trade deficit decreased in September 2019 according to the U.S. Bureau of Economic Analysis and the U.S. Census Bureau. The deficit decreased from $55.0 billion in August (revised) to $52.5 billion in September, as imports decreased more than exports. The previously published August deficit was $54.9 billion. The goods deficit decreased $2.7 billion in September to $71.7 billion. The services surplus decreased $…
U.S. International Trade in Goods and Services, September 2019
The U.S. monthly international trade deficit decreased in September 2019 according to the U.S. Bureau of Economic Analysis and the U.S. Census Bureau. The deficit decreased from $55.0 billion in August (revised) to $52.5 billion in September, as imports decreased more than exports. The previously published August deficit was $54.9 billion. The goods deficit decreased $2.7 billion in September to $71.7 billion. The services surplus decreased $0.1…
Real Disposable Personal Income Rises in September
Personal income increased 0.3 percent in September after increasing 0.5 percent in August. Wages and salaries, the largest component of personal income, showed no change in September after increasing 0.6 percent in August.
Personal Income and Outlays, September 2019
Personal income increased 0.3 percent in September after increasing 0.5 percent in August. Wages and salaries, the largest component of personal income, showed no change in September after increasing 0.6 percent in August.
GDP Increases in Third Quarter
Real gross domestic product (GDP) increased 1.9 percent in the third quarter of 2019, according to the “advance” estimate released by the Bureau of Economic Analysis. In the second quarter, real GDP increased 2.0 percent.
Gross Domestic Product, Third Quarter 2019 (Advance Estimate)
Real gross domestic product (GDP) increased 1.9 percent in the third quarter of 2019, according to the “advance” estimate released by the Bureau of Economic Analysis. In the second quarter, real GDP increased 2.0 percent.
Gross Domestic Product by Industry: Second Quarter 2019
Professional, scientific, and technical services; real estate and rental and leasing; and mining were the leading contributors to the increase in U.S. economic growth in the second quarter of 2019. The private goods‐ and services‐producing industries, as well as the government sector, contributed to the increase. Overall, 14 of 22 industry groups contributed to the 2.0 percent increase in real GDP in the second quarter.


