Bureau of Economic Analysis
Annual Update of GDP, Industry, and State Statistics Starts Sept. 25
Release of the annual update of gross domestic product and related statistics, including GDP by industry, begins Sept. 25. Updates of state and county statistics start Sept. 26.
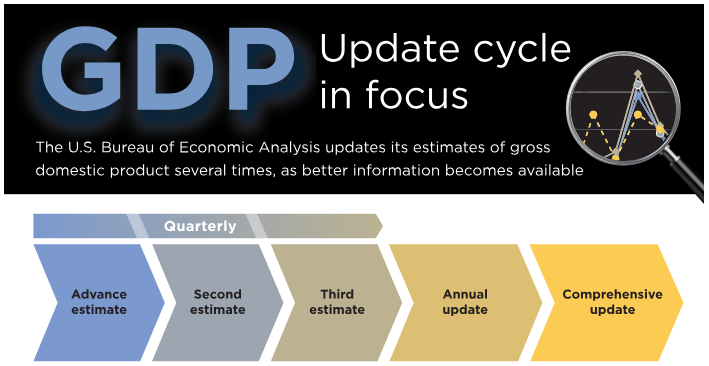
Regular annual updates enable the U.S. Bureau of Economic Analysis to refine our estimates as more complete source data become available. They are also a time to bring in improvements in methodology and presentation. This year, we'll introduce data on business investment in data centers.
Principal Federal Economic Indicators
Noteworthy
The Latest
Gross Domestic Product by State, First Quarter 2019
Real gross domestic product (GDP) increased in all 50 states and the District of Columbia in the first quarter of 2019. The percent change in real GDP in the first quarter ranged from 5.2 percent in West Virginia to 1.2 percent in Hawaii.
Gross Domestic Product by State, First Quarter 2019
Real gross domestic product (GDP) increased in all 50 states and the District of Columbia in the first quarter of 2019. The percent change in real GDP in the first quarter ranged from 5.2 percent in West Virginia to 1.2 percent in Hawaii.
Direct Investment by Country and Industry, 2018
The U.S. direct investment abroad position, or cumulative level of investment, decreased $62.3 billion to $5.95 trillion at the end of 2018 from $6.01 trillion at the end of 2017. The decrease was due to the repatriation of accumulated prior earnings by U.S. multinationals from their foreign affiliates, largely in response to the 2017 Tax Cuts and Jobs Act. The decrease reflected a $75.8 billion decrease in the position in Latin America and…
Gross Domestic Product by Industry: First Quarter 2019
Finance and insurance; retail trade; and health care and social assistance were the leading contributors to the increase in U.S. economic growth in the first quarter of 2019. Overall, 16 of 22 industry groups contributed to the 3.1 percent increase in real GDP in the first quarter.
Five Years of GDP Data Will Be Updated July 26
The U.S. Bureau of Economic Analysis is expanding our annual updates that bring the economic picture of previous years into sharper focus. Starting with the July 26 update, we’ll begin revisiting at least five years of national statistics, instead of three, each summer.
In these summer updates, we use newly available data to refine earlier estimates of the nation’s gross domestic product and related statistics. GDP is…
May 2019 Trade Gap is $55.5 Billion
The U.S. monthly international trade deficit increased in May 2019 according to the U.S. Bureau of Economic Analysis and the U.S. Census Bureau. The deficit increased from $51.2 billion in April (revised) to $55.5 billion in May, as imports increased more than exports. The previously published April deficit was $50.8 billion. The goods deficit increased $4.4 billion in May to $76.1 billion. The services surplus increased $0.1 billion in May…
U.S. International Trade in Goods and Services, May 2019
The U.S. monthly international trade deficit increased in May 2019 according to the U.S. Bureau of Economic Analysis and the U.S. Census Bureau. The deficit increased from $51.2 billion in April (revised) to $55.5 billion in May, as imports increased more than exports. The previously published April deficit was $50.8 billion. The goods deficit increased $4.4 billion in May to $76.1 billion. The services surplus increased $0.1 billion in May to $…
New Foreign Direct Investment in the United States, 2018
Expenditures by foreign direct investors to acquire, establish, or expand U.S. businesses totaled $296.4 billion in 2018, up 8.7 percent from $272.8 billion in 2017.


