Bureau of Economic Analysis
Annual Update of GDP, Industry, and State Statistics Starts Sept. 25
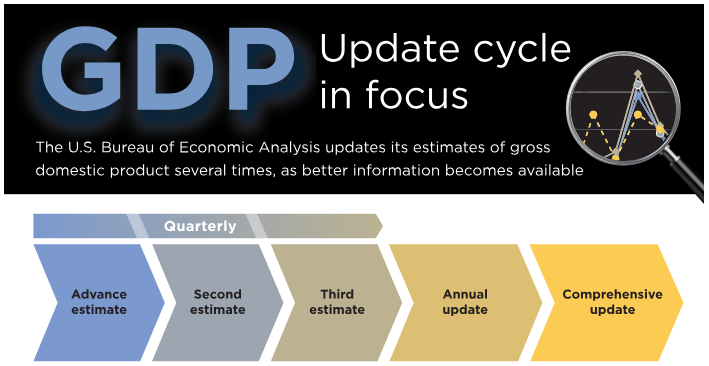
Release of the annual update of gross domestic product and related statistics, including GDP by industry, begins Sept. 25. Updates of state and county statistics start Sept. 26.
Regular annual updates enable the U.S. Bureau of Economic Analysis to refine our estimates as more complete source data become available. They are also a time to bring in improvements in methodology and presentation. This year, we'll introduce data on business investment in data centers.
Principal Federal Economic Indicators
Noteworthy
The Latest
U.S. International Transactions, First Quarter 2019 and Annual Update
The U.S. current-account deficit decreased to $130.4 billion (preliminary) in the first quarter of 2019 from $143.9 billion (revised) in the fourth quarter of 2018. As a percentage of U.S. gross domestic product, the deficit decreased to 2.5 percent from 2.8 percent. The previously published current-account deficit for the fourth quarter was $134.4 billion.
BEA Joins the FSRDC Network: New Secure Locations Now Available for Researchers
For the first time, approved academics and other researchers will be able to access the Bureau of Economic Analysis’ confidential, company-specific trade and investment data from secure locations around the country, making it more convenient for them to do research.
April 2019 Trade Gap is $50.8 Billion
The U.S. monthly international trade deficit decreased in April 2019 according to the U.S. Bureau of Economic Analysis and the U.S. Census Bureau. The deficit decreased from $51.9 billion in March (revised) to $50.8 billion in April, as imports decreased more than exports. The previously published March deficit was $50.0 billion. The goods deficit decreased $1.0 billion in April to $71.7 billion. The services surplus increased $0.1 billion in…
U.S. International Trade in Goods and Services, April 2019
The U.S. monthly international trade deficit decreased in April 2019 according to the U.S. Bureau of Economic Analysis and the U.S. Census Bureau. The deficit decreased from $51.9 billion in March (revised) to $50.8 billion in April, as imports decreased more than exports. The previously published March deficit was $50.0 billion. The goods deficit decreased $1.0 billion in April to $71.7 billion. The services surplus increased $0.1 billion in…
U.S. International Trade in Goods and Services, Annual Revision
The U.S. monthly international trade deficit decreased in April 2019 according to the U.S. Bureau of Economic Analysis and the U.S. Census Bureau. The deficit decreased from $51.9 billion in March (revised) to $50.8 billion in April, as imports decreased more than exports. The previously published March deficit was $50.0 billion. The goods deficit decreased $1.0 billion in April to $71.7 billion. The services surplus increased $0.1 billion in…
Personal Income Rises In April
Personal income increased 0.5 percent in April after increasing 0.1 percent in March. Wages and salaries, the largest component of personal income, increased 0.3 percent in April after increasing 0.4 percent in March.
Personal Income and Outlays, April 2019
Personal income increased 0.5 percent in April after increasing 0.1 percent in March. Wages and salaries, the largest component of personal income, increased 0.3 percent in April after increasing 0.4 percent in March.
GDP Increases in First Quarter
Real gross domestic product increased 3.1 percent in the first quarter of 2019, according to the “second” estimate released by the Bureau of Economic Analysis. The growth rate was 0.1 percentage point lower than the “advance” estimate released in April. In the fourth quarter of 2018, real GDP rose 2.2 percent.
Gross Domestic Product, 1st quarter 2019 (second estimate); Corporate Profits, 1st quarter 2019 (preliminary estimate)
Real gross domestic product (GDP) increased at an annual rate of 3.1 percent in the first quarter of 2019, according to the "second" estimate released by the Bureau of Economic Analysis. In the fourth quarter, real GDP increased 2.2 percent.
Check Out the Buying Power in Your Metro Area
Interested in comparing buying power in your metropolitan area to another? Then, you’ll want to look at the Bureau of Economic Analysis’ latest batch of regional price indexes.
Some highlights from BEA’s recent news release, featuring our 2017 Regional Price Parities:


