Bureau of Economic Analysis
Direct Investment by Country and Industry, 2024
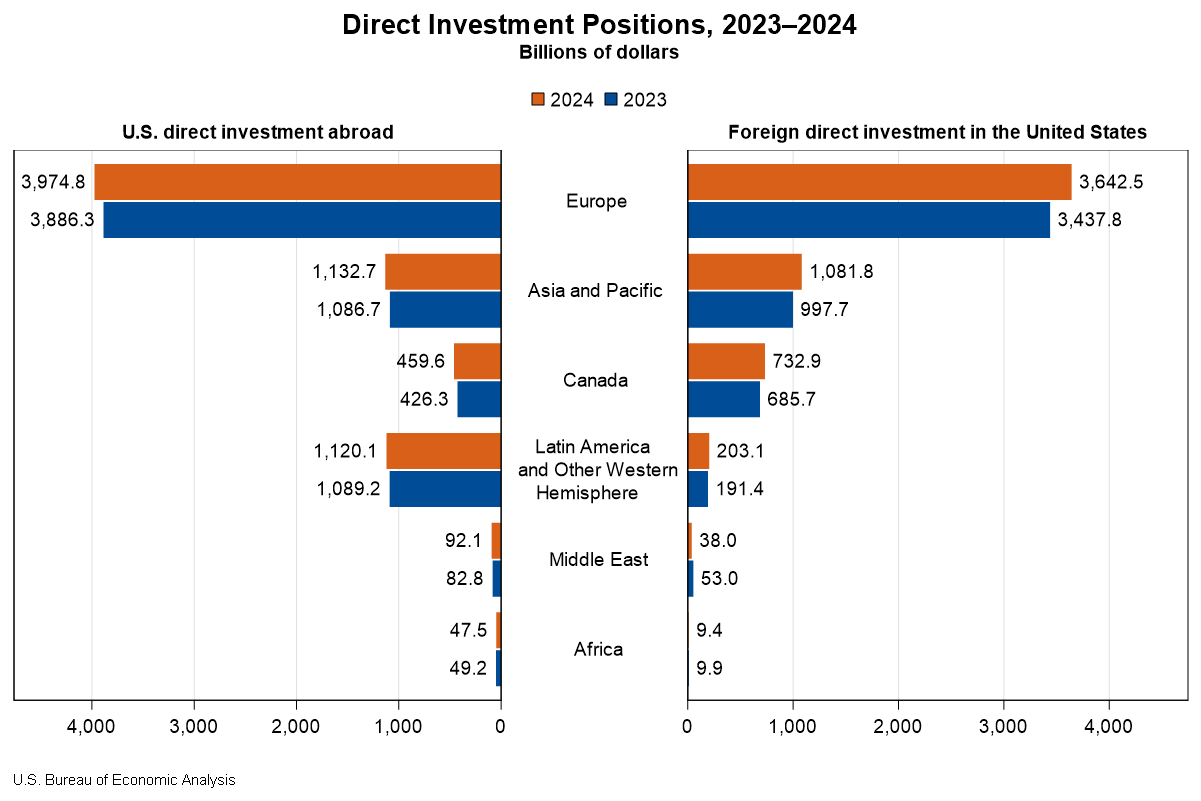
The U.S. direct investment abroad position, or cumulative level of investment, increased $206.3 billion to $6.83 trillion at the end of 2024, according to statistics released today by the U.S. Bureau of Economic Analysis. The increase was led by an $88.4 billion increase in the position in Europe, primarily in Luxembourg and Germany. By industry, manufacturing affiliates had the largest increase, led by manufacturing of computers and electronic products.
The foreign direct investment in the United States position increased $332.1 billion to $5.71 trillion at the end of 2024. The increase was led by a $204.7 billion increase in the position from Europe, which reflected a $52.9 billion increase from the United Kingdom and a $39.7 billion increase from Germany. By industry, affiliates in manufacturing increased the most.
Principal Federal Economic Indicators
Noteworthy
- 2025 News Release Schedule
- Innovation at BEA
- 2025 Annual Updates
- New! Services Trade Data for More Countries
- Data Tool: Trade in Value Added
- Distribution of State Personal Income
- Updated: RIMS II Regional Multipliers
- Arts and Culture
- Space Economy
- FDI Now in State BEARFACTS
- Quick Guide: Price Indexes
The Latest
Local Area Personal Income: 2017
Personal income increased in 2,787 counties, decreased in 318, and was unchanged in 8 in 2017. Personal income increased 4.5 percent in the metropolitan portion of the United States and increased 3.2 percent in the nonmetropolitan portion in 2017. The change in personal income ranged from -41.4 percent in Slope County, North Dakota to 23.7 percent in Crosby County, Texas in 2017 (BEA interactive data).
Local Area Personal Income
Personal income increased in 2,787 counties, decreased in 318, and was unchanged in 8 in 2017. Personal income increased 4.5 percent in the metropolitan portion of the United States and increased 3.2 percent in the nonmetropolitan portion in 2017. The change in personal income ranged from -41.4 percent in Slope County, North Dakota to 23.7 percent in Crosby County, Texas in 2017.
Gross Domestic Product (GDP) by State: Second Quarter 2018
Real gross domestic product increased in all 50 states and the District of Columbia in the second quarter of 2018. The percent change in real GDP in the second quarter ranged from 6.0 percent in Texas to 2.5 percent in Delaware. Information services; real estate and rental and leasing; professional, scientific, and technical services; and durable goods manufacturing were the leading contributors to the increase in real GDP…
Gross Domestic Product by State, 2nd quarter 2018
Real gross domestic product (GDP) increased in all 50 states and the District of Columbia in the second quarter of 2018, according to statistics released today by the U.S. Bureau of Economic Analysis. The percent change in real GDP in the second quarter ranged from 6.0 percent in Texas to 2.5 percent in Delaware.
Guam GDP Increases in 2017
The estimates of GDP for Guam show that real GDP—GDP adjusted to remove price changes—increased 0.2 percent in 2017 after increasing 0.3 percent in 2016. For comparison, real GDP for the United States (excluding the territories) increased 2.2 percent in 2017 after increasing 1.6 percent in 2016.
Guam GDP Increases in 2017
The estimates of GDP for Guam show that real GDP—GDP adjusted to remove price changes—increased 0.2 percent in 2017 after increasing 0.3 percent in 2016. For comparison, real GDP for the United States increased 2.2 percent in 2017 after increasing 1.6 percent in 2016.
Activities of U.S. Affiliates of Foreign Multinational Enterprises, 2016
Majority-owned U.S. affiliates (MOUSAs) of foreign multinational enterprises (MNEs) employed 7.1 million workers (preliminary) in the United States in 2016, a 3.9 percent increase from 6.8 million (revised) in 2015, according to the Bureau of Economic Analysis.
Activities of U.S. Affiliates of Foreign Multinational Enterprises, 2016
Majority-owned U.S. affiliates (MOUSAs) of foreign multinational enterprises (MNEs) employed 7.1 million workers (preliminary) in the United States in 2016, a 3.9 percent increase from 6.8 million (revised) in 2015, according to statistics on MOUSA operations and finances released by the Bureau of Economic Analysis.
Changes to BEA's Regional Data Tables Improve Consistency
The Bureau of Economic Analysis made changes today to some of our tables showing data about states, counties, metro areas, and other local areas. The changes make the presentation of data more consistent across BEA’s regional tables.
These changes in the way gross domestic product and personal income figures are displayed affect only the presentation, not the actual data. But users of BEA’s developer tools, interactive database, and…
September 2018 Trade Gap is $54.0 Billion
The U.S. monthly international trade deficit increased in September 2018 according to the U.S. Bureau of Economic Analysis and the U.S. Census Bureau. The deficit increased from $53.3 billion in August (revised) to $54.0 billion in September, as imports increased more than exports. The previously published August deficit was $53.2 billion. The goods deficit increased $0.6 billion in September to $77.2 billion. The services surplus decreased $…


