
Bureau of Economic Analysis
New Foreign Direct Investment in the United States, 2024
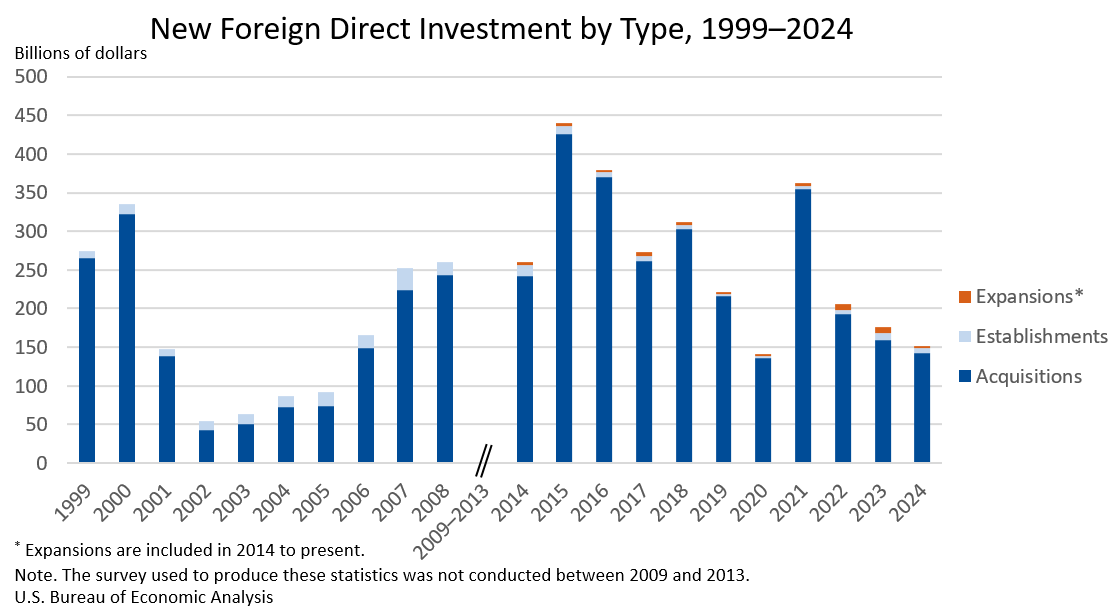
Expenditures by foreign direct investors to acquire, establish, or expand U.S. businesses totaled $151.0 billion in 2024, according to preliminary statistics released today by the U.S. Bureau of Economic Analysis. Expenditures decreased $24.9 billion, or 14.2 percent, from $176.0 billion (revised) in 2023 and were below the annual average of $277.2 billion for 2014–2023. As in previous years, acquisitions of existing U.S. businesses accounted for most of the expenditures.
Principal Federal Economic Indicators
Noteworthy
- 2025 News Release Schedule
- Innovation at BEA
- 2025 Annual Updates
- New! Services Trade Data for More Countries
- Data Tool: Trade in Value Added
- Distribution of State Personal Income
- Updated: RIMS II Regional Multipliers
- Arts and Culture
- Space Economy
- FDI Now in State BEARFACTS
- Quick Guide: Price Indexes


The Latest
Gross Domestic Product and Corporate Profits, Second Quarter 2008 (final)
Real gross domestic product -- the output of goods and services produced by labor and property located in the United States -- increased at an annual rate of 2.8 percent in the second quarter of 2008, (that is, from the first quarter to the second quarter), according to final estimates released by the Bureau of Economic Analysis. In the first quarter, real GDP increased 0.9 percent. The GDP estimates released today are based on more…
Gross Domestic Product by Metropolitan Area, 2006, and Revised 2004-2005
METROPOLITAN ECONOMIC GROWTH WIDESPREAD IN 2006
Travel and Tourism Satellite Accounts, 2nd quarter 2008
QUARTERLY TOURISM ESTIMATES WILL NOT BE DISCONTINUED (SEE THE BOX NEXT RELEASE)
-->
Real spending on travel and tourism (spending adjusted for price changes) increased at an annual rate of 3.0 percent in 2008:2, according to the Bureau of Economic Analysis. In 2008:1, real spending on travel and tourism grew 0.5 percent (revised). By comparison, real gross domestic product (GDP) grew at an annual rate of 3.3 percent (…
State Quarterly Personal Income, 2nd Quarter 2008
WASHINGTON DC, September 18, 2008 - U.S. personal income grew 1.8 percent in the second quarter of 2008 with growth accelerating in all but five states, according to statistics released today by the U.S. Bureau of Economic Analysis. The second-quarter growth was the highest since the first quarter of 2007 and more than double the 0.8 percent pace of the first quarter of 2008.
U.S. International Transactions: Second Quarter 2008
NOTE: See the navigation bar at the right side of the news release text for links to data tables, contact personnel and their telephone numbers, and supplementary materials.
Douglas B. Weinberg: (202) 606-9590
…
U.S. International Trade in Goods and Services: July 2008
U.S. International Trade in Goods and Services DECEMBER 2007
-->
Personal Income and Outlays, July 2008
July 2008 Personal income decreased $89.9 billion, or 0.7 percent, in July, in contrast to an increase of $7.4 billion, or 0.1 percent, in June and an increase of $218.0 billion, or 1.8 percent, in May. Disposable personal income (DPI) decreased $114.7 billion, or 1.1 percent, in July, compared with a decrease of $208.0 billion, or 1.9 percent, in June and an increase of $595.9 billion, or 5.7 percent in May.
Gross Domestic Product and Corporate Profits, Second Quarter 2008 (preliminary)
Real gross domestic product -- the output of goods and services produced by labor and property located in the United States -- increased at an annual rate of 3.3 percent in the second quarter of 2008, (that is, from the first quarter to the second quarter), according to preliminary estimates released by the Bureau of Economic Analysis. In the first quarter, real GDP increased 0.9 percent. The GDP estimates released today are based on more…
Personal Income for Metropolitan Areas, 2007
WASHINGTON DC, August 7, 2008 - Personal income growth slowed in 2007 in most of the nation's metropolitan statistical areas (MSAs), according to estimates released today by the U.S. Bureau of Economic Analysis. On average, MSA personal income grew 6.2% in 2007, down from 6.8% in 2006. Personal income growth slowed in 208 MSAs, increased in 144, and remained unchanged in 11 MSAs.
Personal Income and Outlays, June 2008
June 2008 Personal income increased $6.8 billion, or 0.1 percent, and disposable personal income (DPI) decreased $210.3 billion, or 1.9 percent, in June, according to the Bureau of Economic Analysis. Personal consumption expenditures (PCE) increased $57.1 billion, or 0.6 percent. In May, personal income increased $219.3 billion, or 1.8 percent, DPI increased $595.4 billion, or 5.7 percent, and PCE increased $76.5 billion, or 0.8 percent,…