
News Release
Activities of U.S. Multinational Enterprises, 2018
Worldwide employment by U.S. multinational enterprises (MNEs) increased 1.4 percent to 43.0 million workers in 2018 from 42.4 million in 2017, according to statistics released by the Bureau of Economic Analysis on the operations and finances of U.S. parent companies and their foreign affiliates.
Employment in the United States by U.S. parents increased 2.1 percent to 28.6 million workers in 2018. U.S. parents accounted for 66.5 percent of worldwide employment by U.S. MNEs, up from 66.1 percent in 2017. Employment abroad by majority-owned foreign affiliates (MOFAs) of U.S. MNEs was nearly unchanged at 14.4 million workers and accounted for 33.5 percent of employment by U.S. MNEs worldwide.

U.S. parents accounted for 22.0 percent of total private industry employment in the United States. Employment by U.S. parents was largest in manufacturing and retail trade. Employment abroad by MOFAs was largest in China, the United Kingdom, Mexico, India, and Canada.
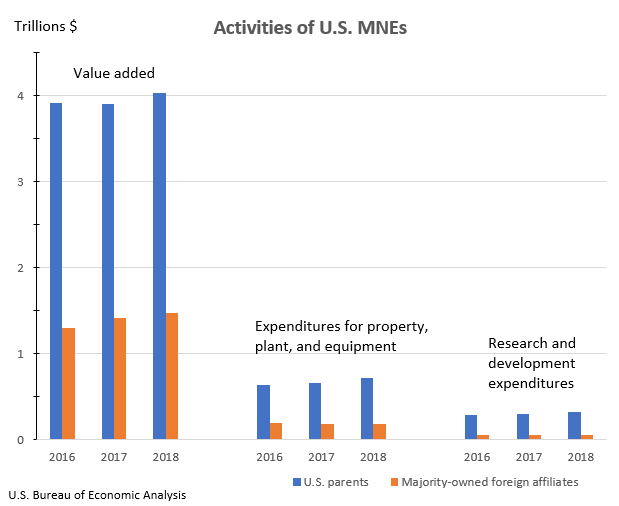
Worldwide current-dollar value added of U.S. MNEs increased 6.8 percent to $5.7 trillion. Value added by U.S. parents, a measure of their direct contribution to U.S. gross domestic product, increased 7.8 percent to $4.2 trillion, representing 23.3 percent of total U.S. private-industry value added. MOFA value added increased 4.1 percent to $1.5 trillion. Value added by MOFAs was largest in the United Kingdom, Canada, and Ireland.
Worldwide expenditures for property, plant, and equipment of U.S. MNEs increased 6.6 percent to $912.1 billion. Expenditures by U.S. parents accounted for $721.6 billion and MOFA expenditures for $190.4 billion.
Worldwide research and development expenditures of U.S. MNEs increased 6.9 percent to $381.4 billion. U.S. parents accounted for expenditures of $323.1 billion and MOFAs for $58.2 billion.
Additional statistics on the activities of U.S. parent companies and their foreign affiliates including sales, balance sheet and income statement items, compensation of employees, trade in goods, and more are available on BEA’s website. More industry detail for U.S. parents and more industry and country detail for foreign affiliates are also available on the website.
The TCJA generally eliminated taxes on dividends, or repatriated earnings, to U.S. multinationals from their foreign affiliates and changed the nominal U.S. domestic corporate tax rate from 35 percent to 21 percent beginning on January 1, 2018. BEA’s statistics cannot separate the effects of the TCJA from other prevalent economic conditions and company-specific factors in 2018, however, the statistics on the Activities of U.S. MNEs for 2018 in this release provide a first look at U.S. MNE activities in the year after the TCJA took effect.
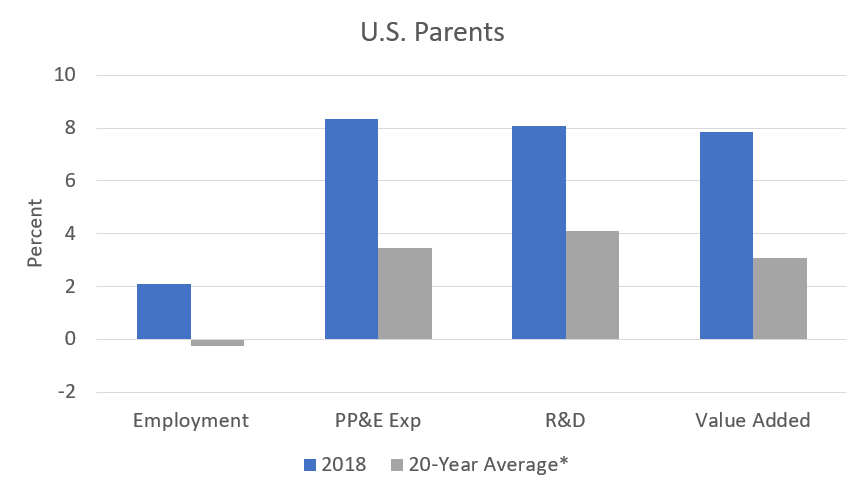
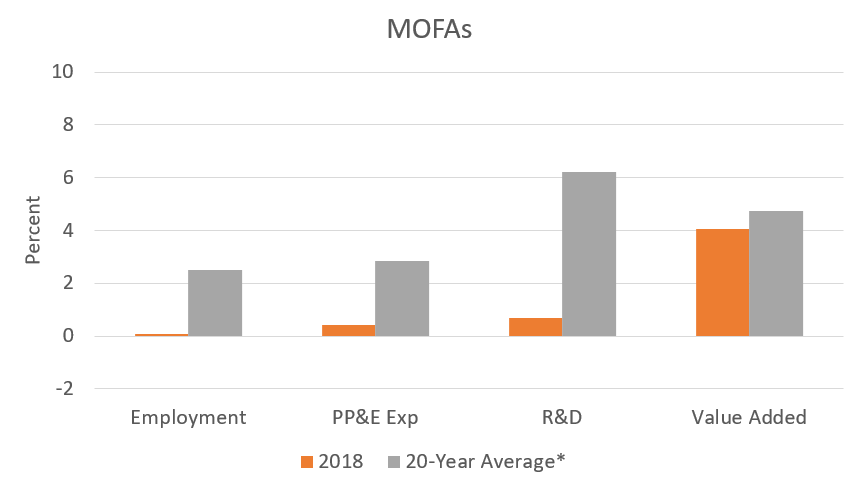
U.S. parents grew faster than MOFAs in 2018 for several measures of their activities, including employment, value added, expenditures for property, plant, and equipment (PP&E), and research and development expenditures (R&D). This contrasts with the long-term trend of MOFA activities growth outpacing that of U.S. parents. In 2018, U.S. parents experienced above-average growth rates for these measures, while MOFAs grew at below-average rates.
Annual Percent Change in Activities of U.S. MNEs
*1998-2018, rates for benchmark years (1999, 2004, 2009, and 2014) not included
In addition to the measures of MNE activities featured in this release, BEA’s U.S. MNE statistics include U.S. income taxes paid by U.S. parents. According to the statistics, U.S. income taxes paid by U.S. parents decreased 6.4 percent to $218.9 billion in 2018 (see Table I. P1). The effective U.S. income tax rate paid by U.S. parents decreased to 13.1 percent in 2018, following an effective rate of 15.4 percent in 2017 and between 18.4 and 22.3 percent for the five previous years.
Updates to the statistics
Statistics for 2017 are revised to incorporate newly available and revised source data. Preliminary statistics for 2017 were released in August 2019 and highlighted in “Activities of U.S. Multinational Enterprises in 2017” in the September 2019 issue of the Survey of Current Business.
| U.S. Parents | MOFAs | |||
| Preliminary estimate |
Revised estimate |
Preliminary estimate |
Revised estimate |
|
|---|---|---|---|---|
| Number of employees (thousands) | 28,071.2 | 27,981.7 | 14,399.9 | 14,381.7 |
| Value added | 3,902.5 | 3,901.8 | 1,418.4 | 1,416.4 |
| Expenditures for property, plant, and equipment | 653.6 | 666.2 | 199.6 | 189.6 |
| Research and development expenditures | 298.3 | 299.0 | 56.6 | 57.8 |
Activities of U.S. Multinational Enterprises, 2019