
News Release
U.S. International Transactions, Fourth Quarter and Year 2020
Current Account Deficit Widens by 4.2 Percent in Fourth Quarter
Current Account Balance, Fourth Quarter
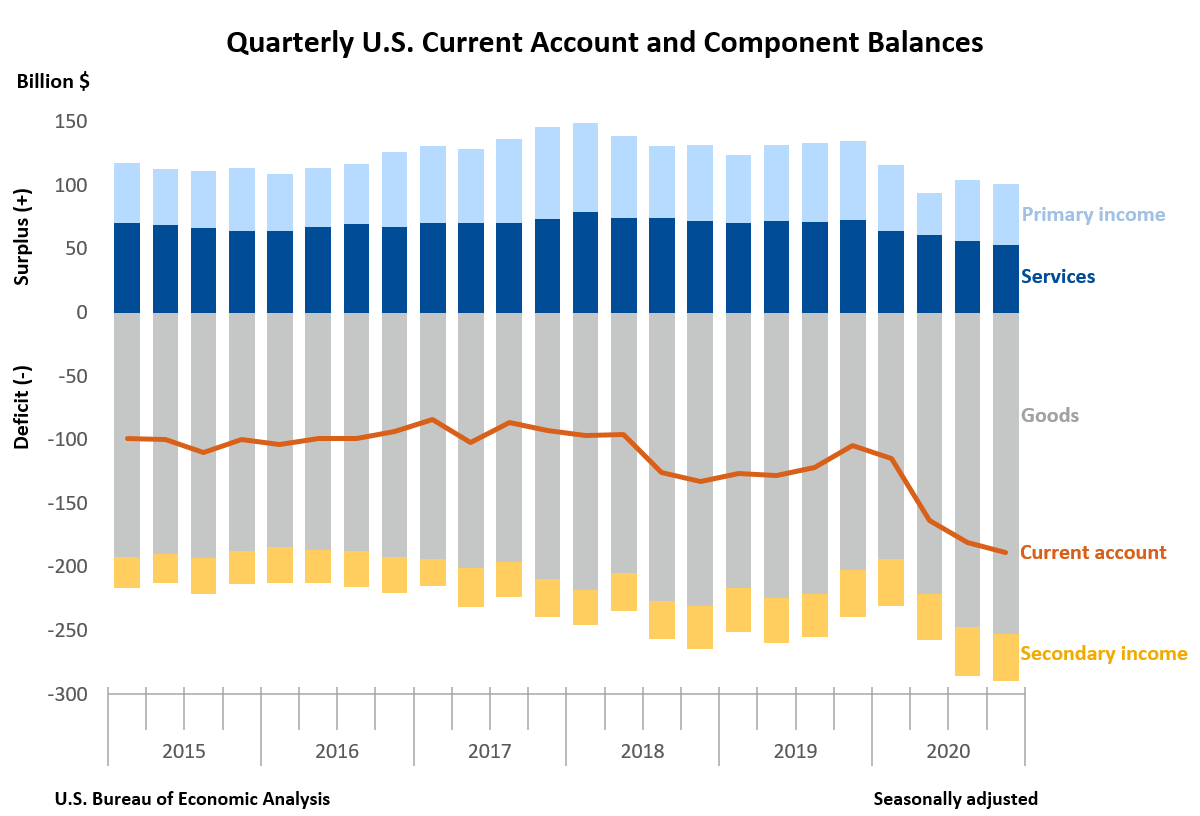
The U.S. current account deficit, which reflects the combined balances on trade in goods and services and income flows between U.S. residents and residents of other countries, widened by $7.6 billion, or 4.2 percent, to $188.5 billion in the fourth quarter of 2020, according to statistics released by the U.S. Bureau of Economic Analysis. The revised third quarter deficit was $180.9 billion.
The fourth quarter deficit was 3.5 percent of current dollar gross domestic product (GDP), up from 3.4 percent in the third quarter.
The $7.6 billion widening of the current account deficit in the fourth quarter primarily reflected an expanded deficit on goods and a reduced surplus on services that were partly offset by a reduced deficit on secondary income.
Current Account Transactions (tables 1-5)
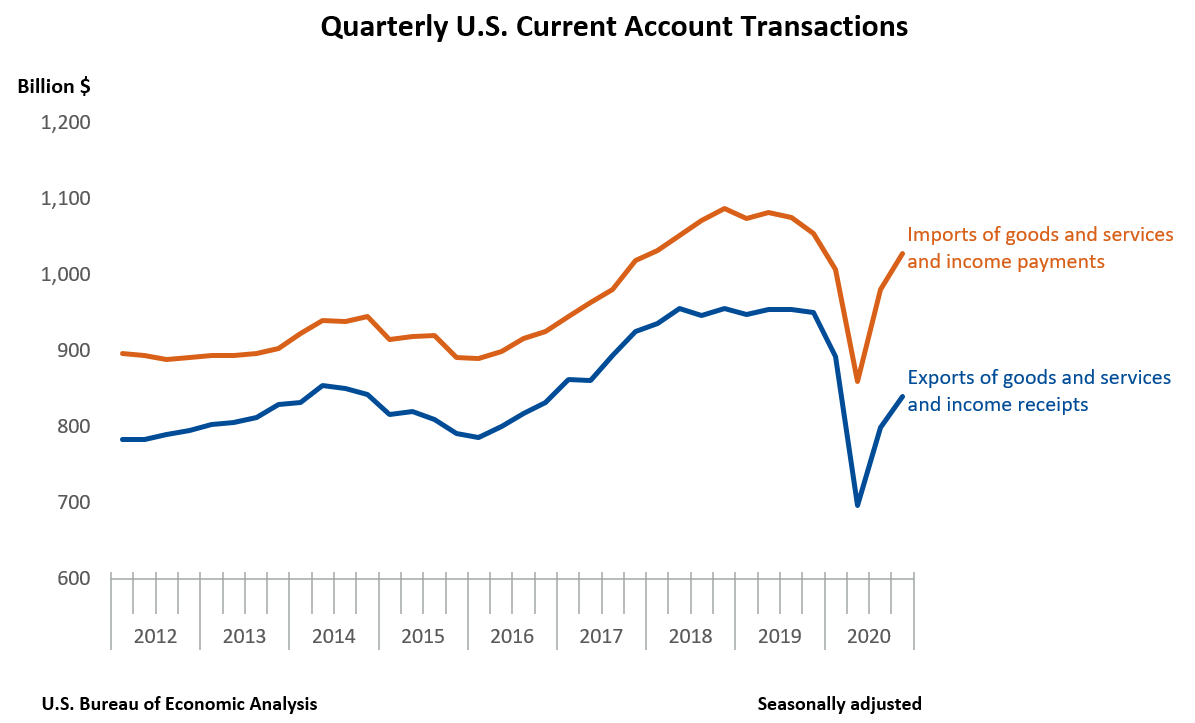
Exports of goods and services to, and income received from, foreign residents increased $40.8 billion, to $840.0 billion, in the fourth quarter. Imports of goods and services from, and income paid to, foreign residents increased $48.3 billion, to $1.03 trillion.
Trade in Goods (table 2)
Exports of goods increased $30.9 billion, to $387.5 billion, and imports of goods increased $36.4 billion, to $640.5 billion. The increases in both exports and imports reflected increases in nearly all major categories. The increase in exports was led by industrial supplies and materials and capital goods, and the increase in imports was led by industrial supplies and materials; automotive vehicles, parts, and engines; and consumer goods.
Trade in Services (table 3)
Exports of services increased $3.8 billion, to $168.1 billion, mainly reflecting increases in travel, primarily other personal travel, and in transport, mostly air freight and air passenger transport. Imports of services increased $6.9 billion, to $115.1 billion, mostly reflecting increases in travel, primarily other personal travel, and in transport, primarily sea freight transport.
Primary Income (table 4)
Receipts of primary income increased $7.1 billion, to $248.4 billion, and payments of primary income increased $7.5 billion, to $200.5 billion. The increases in both receipts and payments mainly reflected increases in direct investment income, mostly earnings, and in portfolio investment income, mostly income on equity securities.
Secondary Income (table 5)
Receipts of secondary income decreased $1.0 billion, to $36.0 billion, reflecting a decrease in private transfers, mostly private sector fines and penalties, that was partly offset by an increase in general government transfers, primarily taxes on income and wealth. Payments of secondary income decreased $2.4 billion, to $72.4 billion, reflecting decreases in private transfers, mostly private sector fines and penalties, and in general government transfers, mostly international cooperation.
Capital Account Transactions (table 1)
Capital transfer receipts decreased $344 million, to $11 million, in the fourth quarter. Third quarter transactions reflected the U.S. Department of State's sale of a property in Hong Kong. Capital transfer payments increased $0.3 billion, to $1.3 billion, reflecting an increase in investment grants.
Financial Account Transactions (tables 1, 6, 7, and 8)
Net financial account transactions were −$262.4 billion in the fourth quarter, reflecting net U.S. borrowing from foreign residents.
Financial Assets (tables 1, 6, 7, and 8)
Fourth quarter transactions increased U.S. residents' foreign financial assets by $149.8 billion. Transactions increased portfolio investment assets, primarily debt securities, by $82.1 billion; other investment assets by $47.8 billion, resulting from large and partly offsetting transactions in loans and deposits; direct investment assets, primarily equity, by $17.5 billion; and reserve assets by $2.4 billion.
Liabilities (tables 1, 6, 7, and 8)
Fourth quarter transactions increased U.S. liabilities to foreign residents by $414.8 billion. Transactions increased portfolio investment liabilities, mostly equity securities, by $301.4 billion; direct investment liabilities, primarily equity, by $71.3 billion; and other investment liabilities, mostly currency and deposits, by $42.1 billion.
Financial Derivatives (table 1)
Net transactions in financial derivatives were $2.6 billion in the fourth quarter, reflecting net lending to foreign residents.
|
Updates to Third Quarter 2020 International Transactions Accounts Balances Billions of dollars, seasonally adjusted |
||
| Preliminary estimate | Revised estimate | |
|---|---|---|
| Current account balance | −178.5 | −180.9 |
| Goods balance | −245.6 | −247.5 |
| Services balance | 57.2 | 56.1 |
| Primary income balance | 48.1 | 48.2 |
| Secondary income balance | −38.2 | −37.7 |
| Net financial account transactions | −221.1 | −129.4 |
Current Account Balance, Year 2020
The U.S. current account deficit widened by $167.0 billion, or 34.8 percent, to $647.2 billion in 2020. The deficit was 3.1 percent of current dollar GDP, up from 2.2 percent in 2019.
The $167.0 billion widening of the current account deficit in 2020 mostly reflected reduced surpluses on primary income and on services and an expanded deficit on goods.
Current Account Transactions (tables 1-5)
Exports of goods and services to, and income received from, foreign residents decreased $578.3 billion, to $3.23 trillion in 2020. Imports of goods and services from, and income paid to, foreign residents decreased $411.3 billion, to $3.87 trillion.
Trade in Goods (table 2)
Exports of goods decreased $217. 3 billion, to $1.44 trillion, mainly reflecting decreases in capital goods, mostly civilian aircraft, engines, and parts, and in industrial supplies and materials, mostly petroleum and products. Imports of goods decreased $166.1 billion, to $2.35 trillion, mainly reflecting decreases in industrial supplies and materials, mostly petroleum and products, and in automotive vehicles, parts, and engines, mainly passenger cars, that were partly offset by an increase in nonmonetary gold.
Trade in Services (table 3)
Exports of services decreased $183.7 billion, to $692.1 billion, and imports of services decreased $130.1 billion, to $458.3 billion. The decreases in both exports and imports mainly reflected decreases in travel, mostly other personal travel, and in transport, mostly air passenger transport.
Primary Income (table 4)
Receipts of primary income decreased $177.4 billion, to $958.3 billion, mostly reflecting decreases in direct investment income, mostly earnings; in other investment income, primarily interest on loans and deposits; and in portfolio investment income, mostly income on equity securities. Payments of primary income decreased $122.6 billion, to $776.7 billion, mostly reflecting decreases in direct investment income, mostly earnings, and in other investment income, primarily interest on loans and deposits.
Secondary Income (table 5)
Receipts of secondary income increased $0.1 billion, to $142.0 billion, reflecting an increase in private transfers, mostly insurance-related transfers, that was mostly offset by a decrease in general government transfers, mostly government sector fines and penalties. Payments of secondary income increased $7.4 billion, to $289.1 billion, reflecting increases in private transfers, mostly insurance-related transfers, and in general government transfers, primarily international cooperation.
Financial Account Transactions, Year 2020 (tables 1, 6, 7, and 8)
Net financial account transactions were −$743.6 billion in 2020, reflecting net U.S. borrowing from foreign residents.
Financial Assets (tables 1, 6, 7, and 8)
Transactions in 2020 increased U.S. residents' foreign financial assets by $763.5 billion. Transactions increased portfolio investment assets, mostly equity, by $350.2 billion; other investment assets, mostly loans, by $251.0 billion; direct investment assets, mainly equity, by $153.3 billion; and reserve assets by $9.0 billion.
Liabilities (tables 1, 6, 7, and 8)
Transactions in 2020 increased U.S. liabilities to foreign residents by $1.50 trillion. Transactions increased portfolio investment liabilities, mainly equity securities, by $760.0 billion; other investment liabilities, primarily deposits, loans, and currency, by $531.4 billion; and direct investment liabilities, mostly equity, by $212.4 billion.
Financial Derivatives (table 1)
Net transactions in financial derivatives were −$3.3 billion in 2020, reflecting net borrowing from foreign residents.
Upcoming Update to the U.S. International Transactions Accounts
The annual update of the U.S. international transactions accounts will be released along with preliminary estimates for the first quarter of 2021 on June 23, 2021. A preview of the annual update will appear in the April 2021 issue of the Survey of Current Business.
* * *
Next release: June 23, 2021 at 8:30 A.M. EDT
U.S. International Transactions, First Quarter 2021 and Annual Update
* * *