
News Release
U.S. International Transactions, 4th Quarter and Year 2022
Current-Account Balance, Fourth Quarter
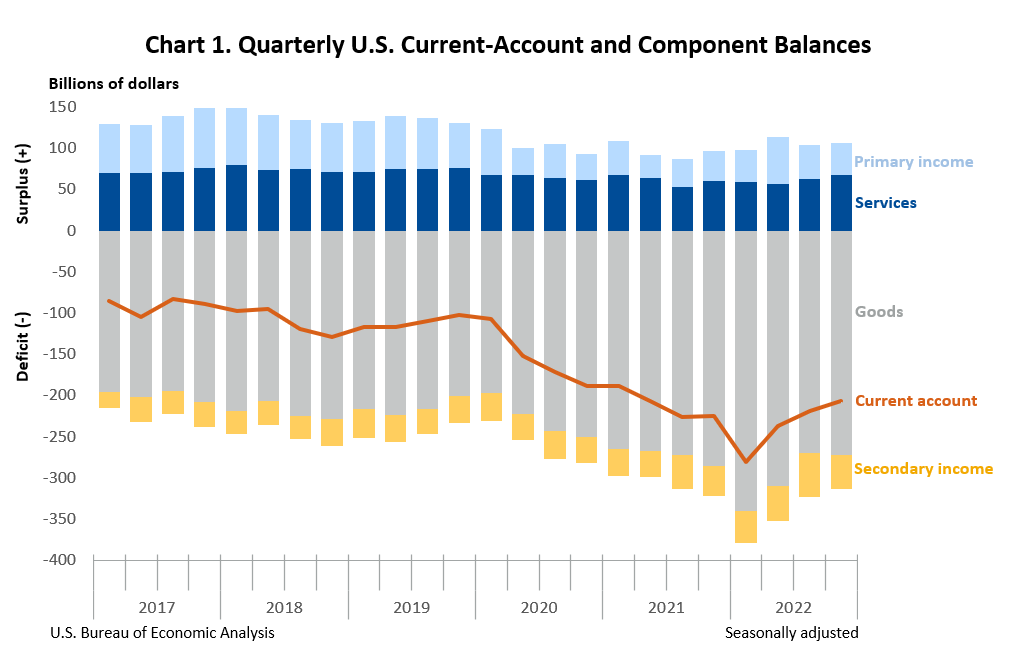
The U.S. current-account deficit, which reflects the combined balances on trade in goods and services and income flows between U.S. residents and residents of other countries, narrowed by $12.2 billion, or 5.6 percent, to $206.8 billion in the fourth quarter of 2022, according to statistics released today by the U.S. Bureau of Economic Analysis. The revised third-quarter deficit was $219.0 billion.
The fourth-quarter deficit was 3.2 percent of current-dollar gross domestic product (GDP), down from 3.4 percent in the third quarter.
The $12.2 billion narrowing of the current-account deficit in the fourth quarter primarily reflected a reduced deficit on secondary income. Also contributing was an expanded surplus on services.
Current-Account Transactions (tables 1–5)
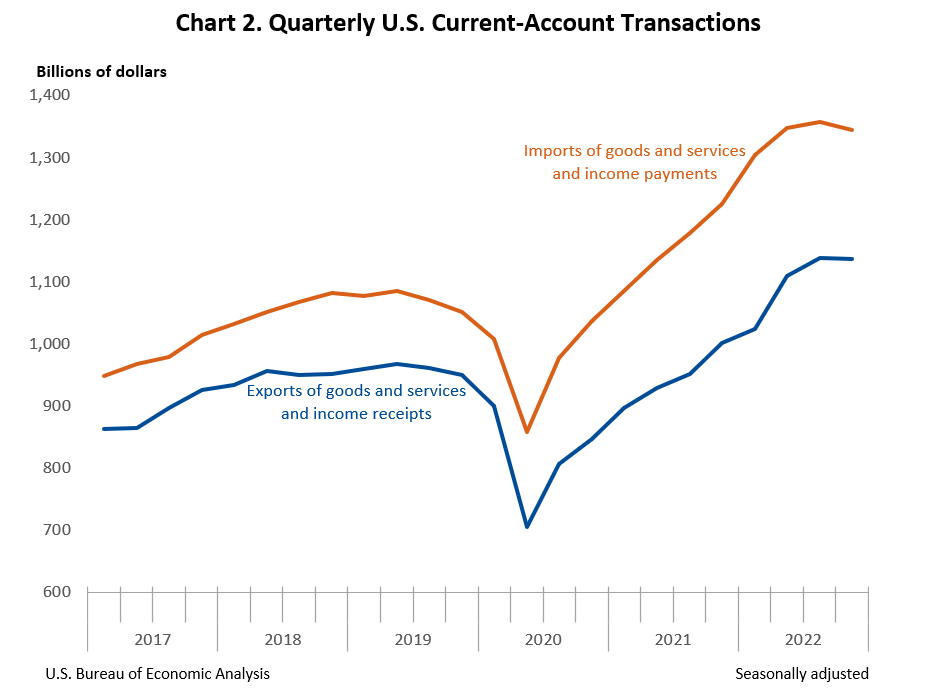
Exports of goods and services to, and income received from, foreign residents decreased $1.1 billion to $1.14 trillion in the fourth quarter. Imports of goods and services from, and income paid to, foreign residents decreased $13.3 billion to $1.34 trillion.1
Trade in goods (table 2)
Exports of goods decreased $31.1 billion to $514.9 billion, reflecting decreases in industrial supplies and materials, mainly other petroleum products and natural gas, and in nonmonetary gold. Imports of goods decreased $28.0 billion to $787.2 billion, reflecting decreases in industrial supplies and materials, mainly petroleum and products, and in consumer goods, mainly other household goods, including cell phones (durable goods) and apparel, footwear, and household goods (nondurable goods).
Trade in services (table 3)
Exports of services increased $6.1 billion to $242.8 billion, reflecting increases in travel, mostly other personal travel, in financial services, mostly financial intermediation services and credit card and other credit-related services, and in transport, mainly air passenger transport. Imports of services increased $1.1 billion to $175.5 billion, reflecting an increase in travel, mostly other personal travel, that was partly offset by a decrease in transport, primarily sea freight transport.
Primary income (table 4)
Receipts of primary income increased $15.6 billion to $328.2 billion, and payments of primary income increased $18.1 billion to $288.9 billion. The increases in both receipts and payments primarily reflected increases in other investment income, mostly interest on loans and deposits. These increases were mainly due to higher short-term interest rates amid tightening of U.S. and foreign monetary policy.
Secondary income (table 5)
Receipts of secondary income increased $8.3 billion to $51.3 billion, reflecting an increase in general government transfers, mainly fines and penalties. Payments of secondary income decreased $4.5 billion to $92.4 billion, reflecting a decrease in general government transfers, mostly international cooperation.
Capital-Account Transactions (table 1)
Capital-transfer receipts decreased $9.1 billion to $8 million in the fourth quarter. Third-quarter transactions reflected receipts from foreign insurance companies for losses resulting from Hurricane Ian. Capital-transfer payments increased $0.3 billion to $4.1 billion, reflecting an increase in infrastructure grants.
Financial-Account Transactions (tables 1, 6, 7, and 8)
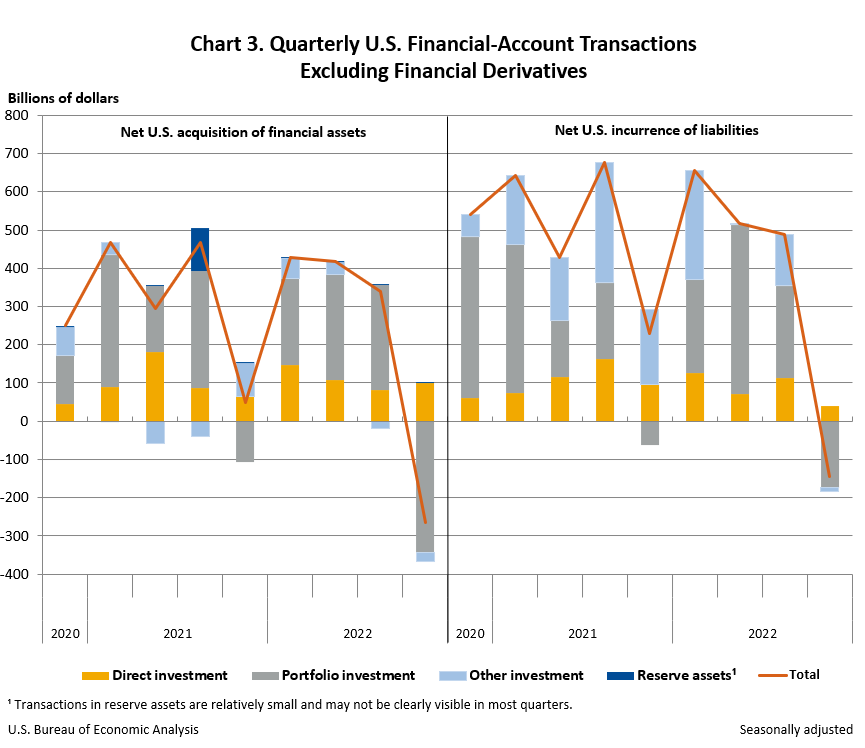
Net financial-account transactions were −$127.5 billion in the fourth quarter, reflecting net U.S. borrowing from foreign residents.
Financial assets (tables 1, 6, 7, and 8)
Fourth-quarter transactions decreased U.S. residents’ foreign financial assets by $264.6 billion. Transactions decreased portfolio investment assets, mostly equity, by $342.4 billion and other investment assets by $24.9 billion, as transactions increased loans and decreased deposits. Transactions increased direct investment assets, mainly equity, by $99.8 billion and reserve assets by $2.9 billion.
Liabilities (tables 1, 6, 7, and 8)
Fourth-quarter transactions decreased U.S. liabilities to foreign residents by $144.1 billion. Transactions decreased portfolio investment liabilities, primarily equity securities, by $173.5 billion and other investment liabilities, primarily deposits, by $11.1 billion. Transactions increased direct investment liabilities, mainly equity, by $40.5 billion.
Financial derivatives (table 1)
Net transactions in financial derivatives were –$6.9 billion in the fourth quarter, reflecting net U.S. borrowing from foreign residents.
|
Table A. Updates to Third-Quarter 2022 International Transactions Accounts Balances [Billions of dollars, seasonally adjusted] |
||
| Preliminary estimates | Revised estimates | |
|---|---|---|
| Current-account balance | –217.1 | −219.0 |
| Goods balance | −271.1 | −269.3 |
| Services balance | 60.5 | 62.3 |
| Primary income balance | 45.6 | 41.8 |
| Secondary income balance | −52.1 | −53.8 |
| Net financial-account transactions | −294.2 | −182.2 |
| U.S. Bureau of Economic Analysis | ||
In addition to revisions to source data for the third quarter of 2022, seasonally adjusted statistics for the first, second, and third quarters of 2022 were revised to force the sum of seasonally adjusted quarters to equal the annual totals. This forcing procedure was also incorporated into the fourth quarter of 2022.
Current-Account Balance, Year 2022
The U.S. current-account deficit widened by $97.4 billion, or 11.5 percent, to $943.8 billion in 2022. The deficit was 3.7 percent of current-dollar GDP, up from 3.6 percent in 2021. The $97.4 billion widening of the current-account deficit in 2022 primarily reflected expanded deficits on goods and on secondary income that were partly offset by an expanded surplus on primary income.
Current-Account Transactions (tables 1–5)
Exports of goods and services to, and income received from, foreign residents increased $629.4 billion to $4.41 trillion in 2022. Imports of goods and services from, and income paid to, foreign residents increased $726.8 billion to $5.35 trillion.
Trade in goods (table 2)
Exports of goods increased $324.5 billion to $2.09 trillion, and imports of goods increased $425.2 billion to $3.28 trillion. The increases in both exports and imports reflected increases in all major components, led by industrial supplies and materials, mainly petroleum and products.
Trade in services (table 3)
Exports of services increased $130.7 billion to $926.0 billion, and imports of services increased $130.3 billion to $680.3 billion. The increases in both exports and imports reflected increases in most major components, led by travel, mostly other personal travel, and transport, mostly air passenger transport.
Primary income (table 4)
Receipts of primary income increased $165.4 billion to $1.22 trillion, and payments of primary income increased $127.5 billion to $1.04 trillion. The increases in both receipts and payments reflected increases in nearly all major components, led by portfolio investment income. Within portfolio investment income, the increase in receipts was due to both dividends on equity securities and interest on debt securities, and the increase in payments was mostly due to interest on debt securities. Higher short-term interest rates in 2022 also contributed to significant increases in both receipts and payments in other investment income, mostly interest on loans and deposits.
Secondary income (table 5)
Receipts of secondary income increased $8.8 billion to $180.2 billion, reflecting an increase in general government transfers, mostly fines and penalties. Payments of secondary income increased $43.8 billion to $356.1 billion, reflecting an increase in general government transfers, mostly international cooperation.
Capital-Account Transactions (table 1)
Capital-transfer receipts increased $5.3 billion to $9.1 billion in 2022. Transactions in 2022 reflected third-quarter receipts from foreign insurance companies for losses resulting from Hurricane Ian. Capital-transfer payments increased $7.4 billion to $13.8 billion, reflecting an increase in infrastructure grants.
Financial-Account Transactions (tables 1, 6, 7, and 8)
Net financial-account transactions were −$677.1 billion in 2022, reflecting net U.S. borrowing from foreign residents.
Financial assets (tables 1, 6, 7, and 8)
Transactions in 2022 increased U.S. residents’ foreign financial assets by $919.8 billion. Transactions increased portfolio investment assets, mainly long-term debt and equity securities, by $437.8 billion; direct investment assets, mostly equity, by $435.8 billion; other investment assets by $40.3 billion, resulting from large and mostly offsetting transactions that increased deposits and decreased loans; and reserve assets by $5.8 billion.
Liabilities (tables 1, 6, 7, and 8)
Transactions in 2022 increased U.S. liabilities to foreign residents by $1.52 trillion. Transactions increased portfolio investment liabilities, mainly long-term debt securities, by $756.8 billion; other investment liabilities, mostly loans, by $407.4 billion; and direct investment liabilities, mostly equity, by $351.6 billion.
Financial derivatives (table 1)
Net transactions in financial derivatives were –$81.0 billion in 2022, reflecting net U.S. borrowing from foreign residents.
Upcoming Update to the U.S. International Transactions Accounts
The annual update of the International Transactions Accounts (ITAs) will be released along with preliminary estimates for the first quarter of 2023 on June 22, 2023. A preview of the annual update will appear in the Survey of Current Business in April 2023.
Change to the Euro Area
With the June 22, 2023, release of the ITAs, statistics beginning with the first quarter of 2023 for the area grouping “Euro Area” will include Croatia, which adopted the euro as its currency effective January 1, 2023.
Next release: June 22, 2023, at 8:30 a.m. EDT
U.S. International Transactions, 1st Quarter 2023 and Annual Update
1 U.S. international transactions are presented in current dollars in accordance with international statistical presentation guidelines. For a comparison of current-dollar, or nominal, and inflation-adjusted, or real, measures of international transactions, see “SECTION 4 – FOREIGN TRANSACTIONS” of the National Income and Product Accounts.