
Bureau of Economic Analysis
U.S. International Investment Position, 3rd Quarter 2025
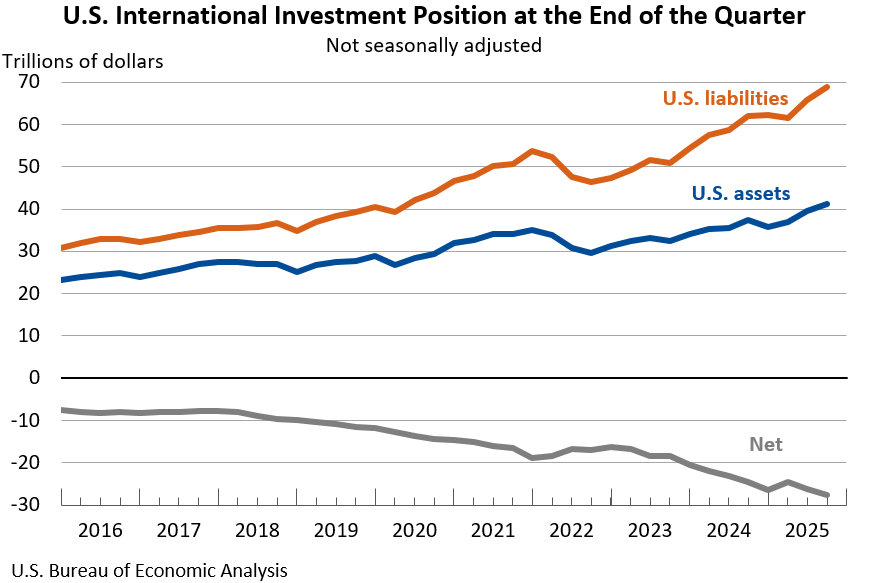
The U.S. net international investment position, the difference between U.S. residents’ foreign financial assets and liabilities, was -$27.61 trillion at the end of the third quarter of 2025, according to statistics released today by the U.S. Bureau of Economic Analysis. Assets totaled $41.27 trillion, and liabilities were $68.89 trillion. At the end of the second quarter, the net investment position was -$26.16 trillion (revised).
Principal Federal Economic Indicators
Noteworthy


The Latest
Personal Income and Outlays, February 2010
Personal income increased $1.2 billion, or less than 0.1 percent, and disposable personal income (DPI) increased $1.6 billion, or less than 0.1 percent, inFebruary, according to the Bureau of Economic Analysis. Personal consumption expenditures (PCE) increased $34.7 billion, or 0.3 percent.
Gross Domestic Product, 4th quarter 2009 (third estimate); Corporate Profits, 4th quarter 2009
Real gross domestic product -- the output of goods and services produced by labor and property located in the United States -- increased at an annual rate of 5.6 percent in the fourth quarter of 2009, (that is, from the third quarter to the fourth quarter), according to the "third" estimate released by the Bureau of Economic Analysis. In the third quarter, real GDP increased 2.2 percent. The GDP estimate released today is based…
State Quarterly Personal Income, 1st quarter 2006-4th quarter 2009; State Annual Personal Income, 2009 (preliminary estimate)
WASHINGTON DC, March 25, 2010 – State personal income declined an average 1.7 percent in 2009, according to estimates released today by the U.S. Bureau of Economic Analysis. The annual percentage change in state personal income ranged from -4.8 percent in Nevada to 2.1 percent in West Virginia (one of six states with a personal income gain in 2009). Inflation, as measured by the national price index for personal consumption expenditures,…
Travel and Tourism Satellite Accounts, 4th Quarter and Annual 2009
QUARTERLY TOURISM ESTIMATES WILL NOT BE DISCONTINUED (SEE THE BOX NEXT RELEASE)
-->
-->
Real spending on travel and tourism decreased at an annual rate of 2.3 percent in 2009:4, following an increase of 6.6 percent (revised) in 2009:3. By comparison, real gross domestic product (GDP) increased 5.9 percent (second estimate) in 2009:4 after increasing 2.2 percent in 2009:3. Travel and tourism prices…
U.S. International Transactions, 4th quarter 2009
NOTE: See the navigation bar at the right side of the news release text for links to data tables, contact personnel and their telephone numbers, and supplementary materials. -->
Personal Income and Outlays, January 2010
Personal income increased $11.4 billion, or 0.1 percent, and disposable personal income (DPI) decreased $47.6 billion, or 0.4 percent, inJanuary, according to the Bureau of Economic Analysis. The decrease in DPI reflected an increase in federal nonwithheld income taxes. Personal consumption expenditures (PCE) increased $52.4 billion, or 0.5 percent.
Gross Domestic Product, 4th quarter 2009 (second estimate)
Real gross domestic product -- the output of goods and services produced by labor and property located in the United States -- increased at an annual rate of 5.9 percent in the fourth quarter of 2009 (that is, from the third quarter to the fourth quarter) according to the "second" estimate released by the Bureau of Economic Analysis. In the third quarter, real GDP increased 2.2 percent. The GDP estimates released today are based on more…