
Bureau of Economic Analysis
U.S. International Investment Position, 3rd Quarter 2025
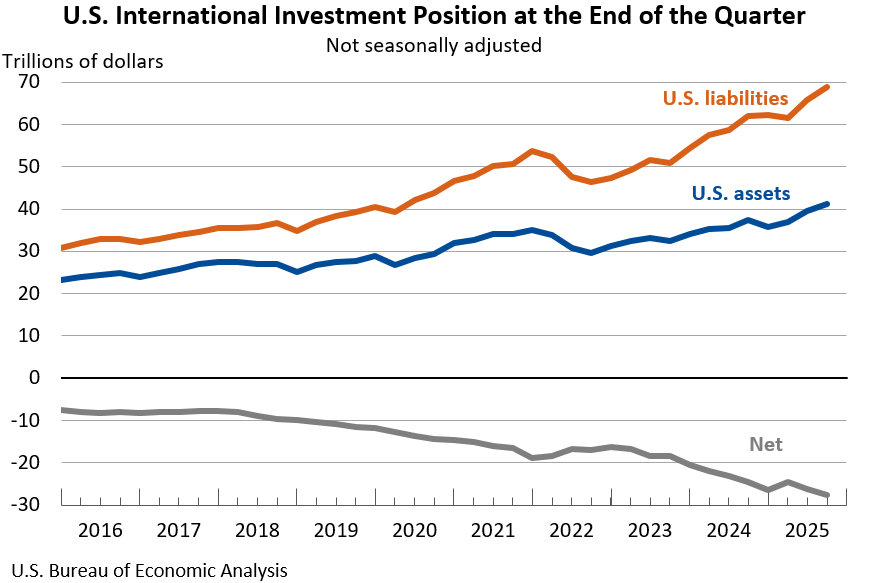
The U.S. net international investment position, the difference between U.S. residents’ foreign financial assets and liabilities, was -$27.61 trillion at the end of the third quarter of 2025, according to statistics released today by the U.S. Bureau of Economic Analysis. Assets totaled $41.27 trillion, and liabilities were $68.89 trillion. At the end of the second quarter, the net investment position was -$26.16 trillion (revised).
Principal Federal Economic Indicators
Noteworthy


The Latest
Personal Income and Outlays, October 2009
Personal income increased $30.1 billion, or 0.2 percent, and disposable personal income (DPI) increased $45.7 billion, or 0.4 percent, inOctober, according to the Bureau of Economic Analysis. Personal consumption expenditures (PCE) increased $68.3 billion, or 0.7 percent.
Gross Domestic Product, 3rd quarter 2009 (second estimate); Corporate Profits, 3rd quarter 2009 (preliminary estimate)
GROSS DOMESTIC PRODUCT: THIRD QUARTER 2009 (SECOND ESTIMATE) CORPORATE PROFITS: THIRD QUARTER 2009 (PRELIMINARY) Real gross domestic product -- the output of goods and services produced by labor and property located in the United States -- increased at an annual rate of 2.8 percent in the third quarter of 2009, (that is, from the second quarter to the third quarter), according to the "…
U.S. International Trade in Goods and Services, September 2009
U.S. International Trade in Goods and Services DECEMBER 2007
-->
Personal Income and Outlays, September 2009
Personal income decreased $0.1 billion, or less than 0.1 percent, and disposable personal income (DPI) decreased $0.2 billion, or less than 0.1 percent, inSeptember, according to the Bureau of Economic Analysis. Personal consumption expenditures (PCE) decreased $47.2 billion, or 0.5 percent.
Gross Domestic Product: Third Quarter 2009 (advance estimate)
GROSS DOMESTIC PRODUCT: THIRD QUARTER 2009 (ADVANCE ESTIMATE) Real gross domestic product -- the output of goods and services produced by labor and property located in the United States -- increased at an annual rate of 3.5 percent in the third quarter of 2009, (that is, from the second quarter to the third quarter), according to the "advance" estimate released by the Bureau of Economic Analysis.
State Personal Income: Second Quarter 2009
U.S. personal income grew 0.2 percent in the second quarter of 2009, the first growth in a year for the U.S. and for 15 states, according to estimates released today by the U.S. Bureau of Economic Analysis. In the first quarter, U.S. personal income fell 2.3 percent.
U.S. International Trade in Goods and Services, August 2009
U.S. International Trade in Goods and Services DECEMBER 2007
-->
Personal Income and Outlays, August 2009
Personal income increased $19.3 billion, or 0.2 percent, and disposable personal income (DPI) increased $15.5 billion, or 0.1 percent, inAugust, according to the Bureau of Economic Analysis. Personal consumption expenditures (PCE) increased $129.6 billion, or 1.3 percent.
Gross Domestic Product: Second Quarter 2009 (Third Estimate)
GROSS DOMESTIC PRODUCT: SECOND QUARTER 2009 (THIRD ESTIMATE) CORPORATE PROFITS: SECOND QUARTER 2009 (REVISED ESTIMATE) Real gross domestic product -- the output of goods and services produced by labor and property located in the United States -- decreased at an annual rate of 0.7 percent in the second quarter of 2009, (that is, from the first quarter to the second quarter), according…
GDP by Metropolitan Area, Accelerated 2008, 2007, and Revised 2005 - 2006
ECONOMIC SLOWDOWN WIDESPREAD IN 2008