
Bureau of Economic Analysis
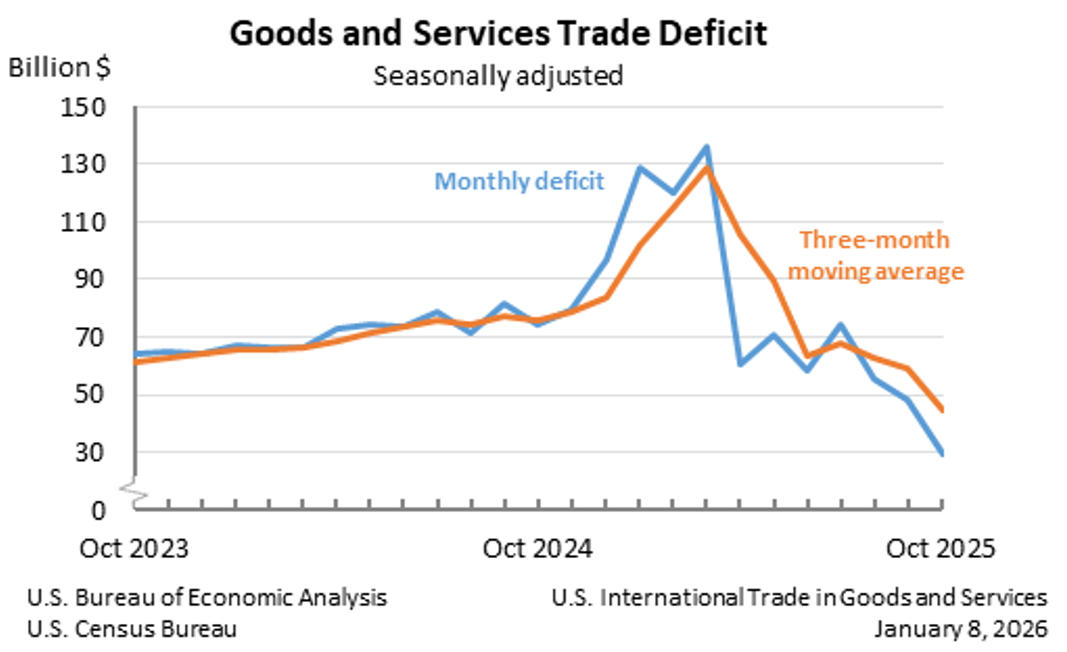
U.S. International Trade in Goods and Services, October 2025
The U.S. goods and services trade deficit decreased in October 2025 according to the U.S. Bureau of Economic Analysis and the U.S. Census Bureau. The deficit decreased from $48.1 billion in September (revised) to $29.4 billion in October, as exports increased and imports decreased. The goods deficit decreased $19.2 billion in October to $59.1 billion. The services surplus decreased $0.4 billion in October to $29.8 billion.
Principal Federal Economic Indicators
Noteworthy


The Latest
Gross Domestic Product (Second Estimate) Corporate Profits (Preliminary Estimate) Second Quarter 2023
Real gross domestic product (GDP) increased at an annual rate of 2.1 percent in the second quarter of 2023, according to the “second” estimate. In the first quarter, real GDP increased 2.0 percent. The increase in the second quarter primarily reflected increases in consumer spending and business investment that were partly offset by a decrease in exports. Imports, which are a subtraction in the calculation of GDP, decreased.
Gross Domestic Product, Second Quarter 2023 (Second Estimate) and Corporate Profits (Preliminary)
Real gross domestic product (GDP) increased at an annual rate of 2.1 percent in the second quarter of 2023, according to the “second” estimate. In the first quarter, real GDP increased 2.0 percent. The increase in the second quarter primarily reflected increases in consumer spending and business investment that were partly offset by a decrease in exports. Imports, which are a subtraction in the calculation of GDP, decreased. Profits decreased…
Activities of U.S Affiliates of Foreign Multinational Enterprises, 2021
Majority-owned U.S. affiliates of foreign multinational enterprises employed 7.94 million workers in the United States in 2021, a 2.9 percent increase from 7.71 million workers in 2020, according to the U.S. Bureau of Economic Analysis (BEA). These affiliates accounted for 6.2 percent of total private-industry employment in the United States in 2021.
Activities of U.S. Affiliates of Foreign Multinational Enterprises, 2021
Majority-owned U.S. affiliates of foreign multinational enterprises employed 7.94 million workers in the United States in 2021, a 2.9 percent increase from 7.71 million workers in 2020, according to the U.S. Bureau of Economic Analysis (BEA). These affiliates accounted for 6.2 percent of total private-industry employment in the United States in 2021.
June 2023 Trade Gap is $65.5 Billion
The U.S. goods and services trade deficit decreased from $68.3 billion in May (revised) to $65.5 billion in June, as imports decreased more than exports. The goods deficit decreased $2.8 billion to $88.2 billion, and the services surplus decreased less than $0.1 billion to $22.7 billion.
U.S. International Trade in Goods and Services, June 2023
The U.S. monthly international trade deficit decreased in June 2023 according to the U.S. Bureau of Economic Analysis and the U.S. Census Bureau. The deficit decreased from $68.3 billion in May (revised) to $65.5 billion in June as imports decreased more than exports. The goods deficit decreased $2.8 billion in June to $88.2 billion. The services surplus decreased less than $0.1 billion in June to $22.7 billion.
Gross Domestic Product for Puerto Rico, 2021
Real gross domestic product (GDP) for Puerto Rico increased 4.0 percent in 2021 after decreasing 6.2 percent in 2020, according to statistics released today by the U.S. Bureau of Economic Analysis.
The increase in real GDP in 2021 primarily reflected an increase in personal consumption expenditures. Private fixed investment also increased. These increases were partly offset by decreases in exports, private inventory investment, and…
Producto interior bruto para Puerto Rico, 2021
El producto interior bruto real (PIB) para Puerto Rico creció 4.0 por ciento en 2021, luego de decrecer 6.2 por ciento en 2020, de acuerdo con las estadísticas difundidas hoy por el Negociado de Análisis Económico de EE. UU.
Producto interior bruto para Puerto Rico, 2021
El producto interior bruto real (PIB) para Puerto Rico creció 4.0 por ciento en 2021, luego de decrecer 6.2 por ciento en 2020. El crecimiento en el PIB real en 2021 reflejó principalmente un crecimiento en los gastos de consumo personal. La inversión bruta en capital fijo también creció. Estos crecimientos se contrarrestaron parcialmente con los decrecimientos en las exportaciones, en la inversión privada en inventarios y en el gasto de…
Gross Domestic Product for Puerto Rico, 2021
Real gross domestic product (GDP) for Puerto Rico increased 4.0 percent in 2021 after decreasing 6.2 percent in 2020. The increase in real GDP in 2021 primarily reflected an increase in personal consumption expenditures. Private fixed investment also increased. These increases were partly offset by decreases in exports, private inventory investment, and government spending. Imports, which is a subtraction item in the calculation of GDP,…