
Bureau of Economic Analysis
U.S. International Trade in Goods and Services, October 2025
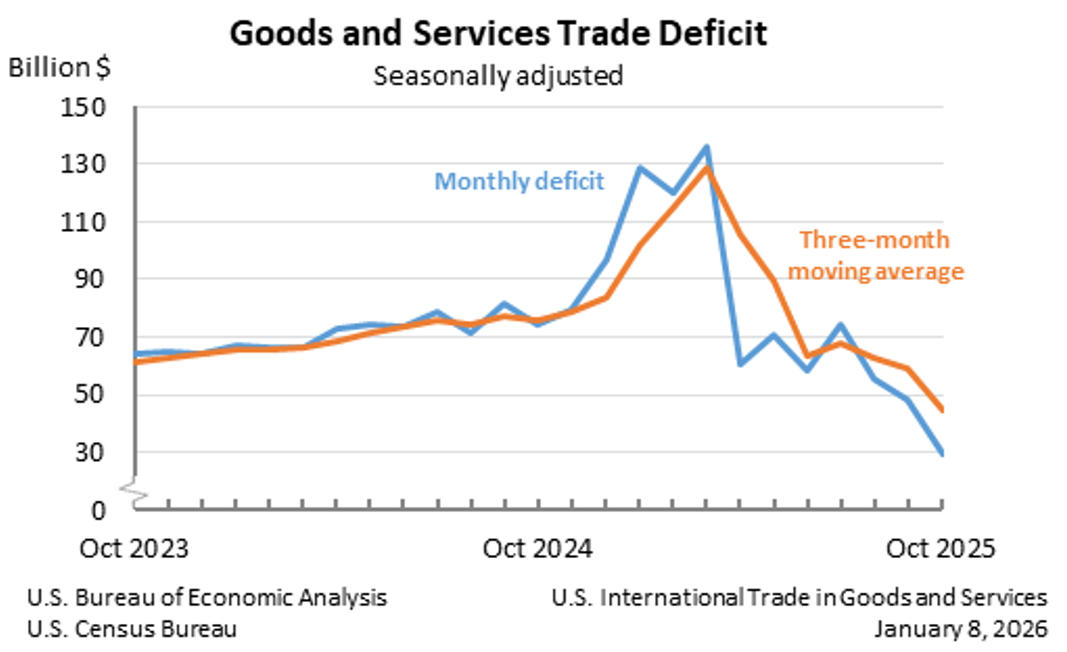
The U.S. goods and services trade deficit decreased in October 2025 according to the U.S. Bureau of Economic Analysis and the U.S. Census Bureau. The deficit decreased from $48.1 billion in September (revised) to $29.4 billion in October, as exports increased and imports decreased. The goods deficit decreased $19.2 billion in October to $59.1 billion. The services surplus decreased $0.4 billion in October to $29.8 billion.
Principal Federal Economic Indicators
Noteworthy


The Latest
Marine Economy Satellite Account, 2021
The Marine Economy Satellite Account statistics released today by the U.S. Bureau of Economic Analysis show the marine economy accounted for 1.9 percent, or $432.4 billion, of current-dollar U.S. gross domestic product in 2021, an increase from 1.7 percent, or $363.2 billion, in 2020. The marine economy accounted for 1.8 percent, or $730.0 billion, of current-dollar gross output.
Marine Economy Satellite Account, 2021
The Marine Economy Satellite Account (MESA) statistics released today by the U.S. Bureau of Economic Analysis (BEA) show the marine economy accounted for 1.9 percent, or $432.4 billion, of current-dollar U.S. gross domestic product (GDP) in 2021, an increase from 1.7 percent, or $363.2 billion, in 2020. The marine economy accounted for 1.8 percent, or $730.0 billion, of current-dollar gross output.
U.S. International Trade in Goods and Services, Annual Revision
The U.S. monthly international trade deficit increased in April 2023 according to the U.S. Bureau of Economic Analysis and the U.S. Census Bureau. The deficit increased from $60.6 billion in March (revised) to $74.6 billion in April as exports decreased and imports increased. The goods deficit increased $14.5 billion in April to $96.1 billion. The services surplus increased $0.6 billion in April to $21.6 billion.
U.S. International Trade in Goods and Services, April 2023
The U.S. monthly international trade deficit increased in April 2023 according to the U.S. Bureau of Economic Analysis and the U.S. Census Bureau. The deficit increased from $60.6 billion in March (revised) to $74.6 billion in April as exports decreased and imports increased. The goods deficit increased $14.5 billion in April to $96.1 billion. The services surplus increased $0.6 billion in April to $21.6 billion.
April 2023 Trade Gap is $74.6 Billion
The U.S. goods and services trade deficit increased from $60.6 billion in March (revised) to $74.6 billion in April, as exports decreased and imports increased. The goods deficit increased $14.5 billion to $96.1 billion, and the services surplus increased $0.6 billion to $21.6 billion.
BEA’s Chief Economist Wins Julius Shiskin Award
BEA Chief Economist Dennis Fixler was selected to receive the 2023 Julius Shiskin Memorial Award for Economic Statistics, which recognizes original and important contributions to statistics used to understand the economy.
Personal Income and Outlays, April 2023
Personal income increased $80.1 billion (0.4 percent at a monthly rate) in April. Disposable personal income (DPI) increased $79.4 billion (0.4 percent). Personal outlays increased $156.0 billion (0.8 percent) and consumer spending increased $151.7 billion (0.8 percent). Personal saving was $802.1 billion and the personal saving rate—personal saving as a percentage of disposable personal income—was 4.1 percent in April.
Gross Domestic Product (Second Estimate) Corporate Profits (Preliminary Estimate) First Quarter 2023
Real gross domestic product (GDP) increased at an annual rate of 1.3 percent in the first quarter of 2023, according to the "second" estimate. In the fourth quarter of 2022, real GDP increased 2.6 percent. The GDP estimate for the first quarter was revised up 0.2 percentage point from the "advance" estimate, primarily reflecting an upward revision to inventory investment.
Gross Domestic Product (Second Estimate), Corporate Profits (Preliminary Estimate), First Quarter 2023
Real gross domestic product (GDP) increased at an annual rate of 1.3 percent in the first quarter of 2023, according to the “second” estimate. In the fourth quarter of 2022, real GDP increased 2.6 percent. The GDP estimate for the first quarter was revised up 0.2 percentage point from the “advance” estimate, primarily reflecting an upward revision to inventory investment. Profits decreased 5.1 percent at a quarterly rate in the first quarter…