
Bureau of Economic Analysis
U.S. International Trade in Goods and Services, October 2025
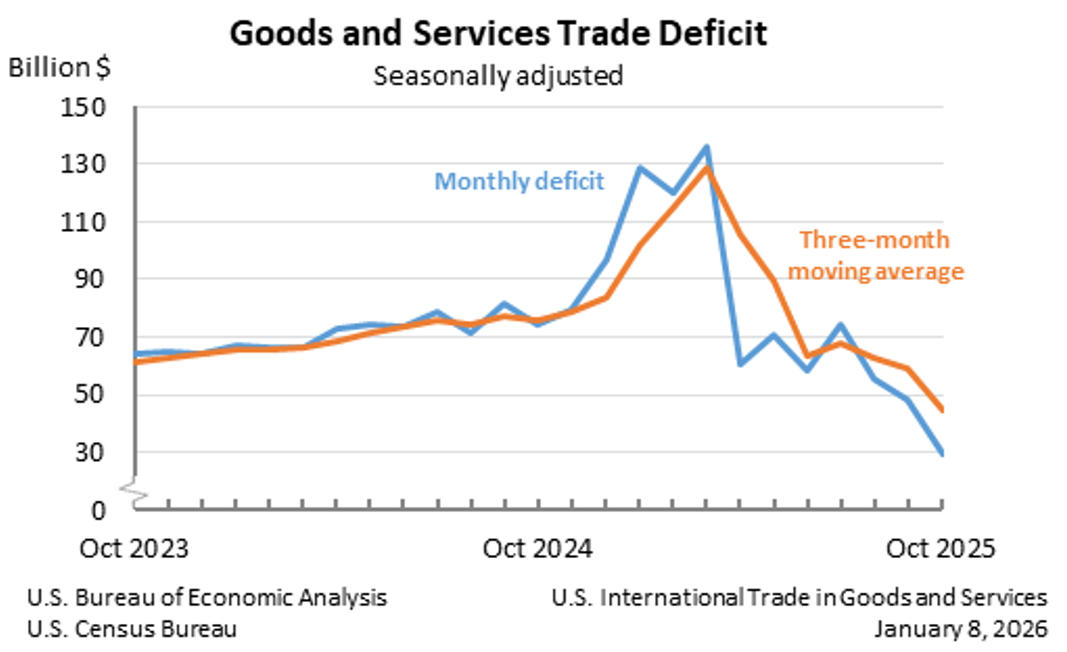
The U.S. goods and services trade deficit decreased in October 2025 according to the U.S. Bureau of Economic Analysis and the U.S. Census Bureau. The deficit decreased from $48.1 billion in September (revised) to $29.4 billion in October, as exports increased and imports decreased. The goods deficit decreased $19.2 billion in October to $59.1 billion. The services surplus decreased $0.4 billion in October to $29.8 billion.
Principal Federal Economic Indicators
Noteworthy


The Latest
Activities of U.S. Affiliates of Foreign Multinational Enterprises, 2018
Majority-owned U.S. affiliates (MOUSAs) of foreign multinational enterprises (MNEs) employed 7.8 million workers in the United States in 2018, a 1.9 percent increase from 7.7 million in 2017, according to the Bureau of Economic Analysis.
Outdoor Recreation Satellite Account, U.S. and States, 2019
The new U.S. data show that the outdoor recreation economy accounted for 2.1 percent ($459.8 billion) of current-dollar gross domestic product (GDP) for the nation in 2019. At the state level, outdoor recreation value added as a share of state GDP ranged from 5.8 percent in Hawaii to 1.3 percent in Connecticut. The share was 1.1 percent in the District of Columbia.
September 2020 Trade Gap is $63.9 Billion
The U.S. monthly international trade deficit decreased in September 2020 according to the U.S. Bureau of Economic Analysis and the U.S. Census Bureau. The deficit decreased from $67.0 billion in August (revised) to $63.9 billion in September, as exports increased more than imports. The previously published August deficit was $67.1 billion. The goods deficit decreased $3.1 billion in September to $80.7 billion. The services surplus increased…
U.S. International Trade in Goods and Services, September 2020
The U.S. monthly international trade deficit decreased in September 2020 according to the U.S. Bureau of Economic Analysis and the U.S. Census Bureau. The deficit decreased from $67.0 billion in August (revised) to $63.9 billion in September, as exports increased more than imports. The previously published August deficit was $67.1 billion. The goods deficit decreased $3.1 billion in September to $80.7 billion. The services surplus increased less…
Personal Income and Outlays, September 2020
Personal income increased 0.9 percent while consumer spending increased 1.4 percent in September, according to estimates released today by the Bureau of Economic Analysis.
Personal Income and Outlays, September 2020
Personal income increased 0.9 percent while consumer spending increased 1.4 percent in September, according to estimates released today by the Bureau of Economic Analysis.
Gross Domestic Product, Third Quarter 2020 (Advance Estimate)
Real gross domestic product (GDP) increased at an annual rate of 33.1 percent in the third quarter of 2020, as efforts continued to reopen businesses and resume activities that were postponed or restricted due to COVID-19. In the second quarter of 2020, real GDP decreased 31.4 percent. For more details, including source data, see the Technical Note.
Gross Domestic Product, Third Quarter 2020 (Advance Estimate)
Real gross domestic product (GDP) increased at an annual rate of 33.1 percent in the third quarter of 2020, as efforts continued to reopen businesses and resume activities that were postponed or restricted due to COVID-19. In the second quarter of 2020, real GDP decreased 31.4 percent.