
Bureau of Economic Analysis
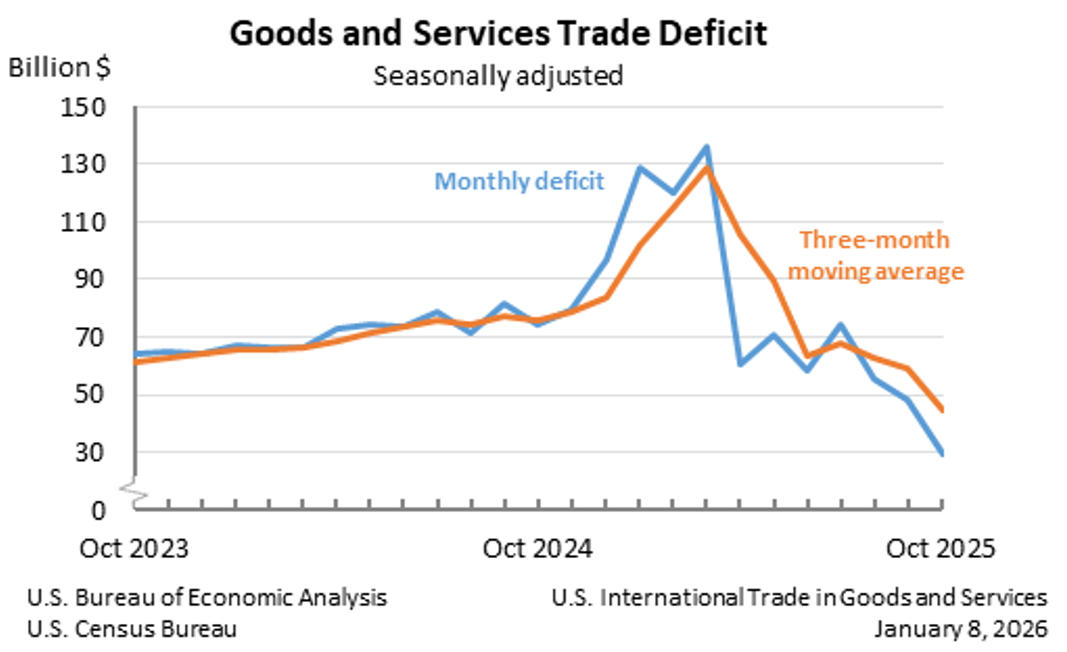
U.S. International Trade in Goods and Services, October 2025
The U.S. goods and services trade deficit decreased in October 2025 according to the U.S. Bureau of Economic Analysis and the U.S. Census Bureau. The deficit decreased from $48.1 billion in September (revised) to $29.4 billion in October, as exports increased and imports decreased. The goods deficit decreased $19.2 billion in October to $59.1 billion. The services surplus decreased $0.4 billion in October to $29.8 billion.
Principal Federal Economic Indicators
Noteworthy


The Latest
Gross Domestic Product, Fourth Quarter and Year 2020 (Second Estimate)
Real gross domestic product (GDP) increased at an annual rate of 4.1 percent in the fourth quarter of 2020, reflecting both the continued economic recovery from the sharp declines earlier in the year and the ongoing impact of the COVID-19 pandemic, including new restrictions and closures that took effect in some areas of the United States. The increase was 0.1 percentage point higher than the “advance” estimate released in January. In the third…
Gross Domestic Product for Guam, 2019
The estimates of GDP for Guam show that real GDP—GDP adjusted to remove price changes—increased 2.0 percent in 2019. This release also includes the results of a comprehensive update of the territorial economic accounts.
Gross Domestic Product for Guam, 2019
The estimates of GDP for Guam show that real GDP—GDP adjusted to remove price changes—increased 2.0 percent in 2019.
2020 Trade Gap is $678.7 Billion
The U.S. international trade deficit increased in 2020 according to the U.S. Bureau of Economic Analysis and the U.S. Census Bureau. The deficit increased from $576.9 billion in 2019 to $678.7 billion in 2020, as exports decreased more than imports. As a percentage of U.S. gross domestic product, the goods and services deficit was 3.2 percent in 2020, up from 2.7 percent in 2019. The goods deficit increased from $864.3 billion in 2019 to $915…
December 2020 Trade Gap is $66.6 Billion
The U.S. monthly international trade deficit decreased in December 2020 according to the U.S. Bureau of Economic Analysis and the U.S. Census Bureau. The deficit decreased from $69.0 billion in November (revised) to $66.6 billion in December, as exports increased more than imports. The previously published November deficit was $68.1 billion. The goods deficit decreased $2.8 billion in December to $84.2 billion. The services surplus decreased…
U.S. International Trade in Goods and Services, December 2020
The U.S. monthly international trade deficit decreased in December 2020 according to the U.S. Bureau of Economic Analysis and the U.S. Census Bureau. The deficit decreased from $69.0 billion in November (revised) to $66.6 billion in December, as exports increased more than imports. The previously published November deficit was $68.1 billion. The goods deficit decreased $2.8 billion in December to $84.2 billion. The services surplus decreased $0.…
Personal Income and Outlays, December 2020
Personal income increased 0.6 percent (monthly rate) while consumer spending decreased 0.2 percent in December as many provisions of the CARES Act continued to wind down before the Coronavirus Response and Relief Supplemental Appropriations (CRRSA) Act was enacted on December 27, 2020. Additionally, new restrictions and closures took effect in some areas of the United States.
Gross Domestic Product, Fourth Quarter and Year 2020
Real gross domestic product (GDP) increased at an annual rate of 4.0 percent in the fourth quarter of 2020, reflecting both the continued economic recovery from the sharp declines earlier in the year and the ongoing impact of the COVID-19 pandemic, including new restrictions and closures that took effect in some areas of the United States. In the third quarter, real GDP increased 33.4 percent. For more details, including source data, see the…
Gross Domestic Product, 4th Quarter and Year 2020 (Advance Estimate)
Real gross domestic product (GDP) increased at an annual rate of 4.0 percent in the fourth quarter of 2020, reflecting both the continued economic recovery from the sharp declines earlier in the year and the ongoing impact of the COVID-19 pandemic, including new restrictions and closures that took effect in some areas of the United States. In the third quarter, real GDP increased 33.4 percent.