
Bureau of Economic Analysis
U.S. International Trade in Goods and Services, October 2025
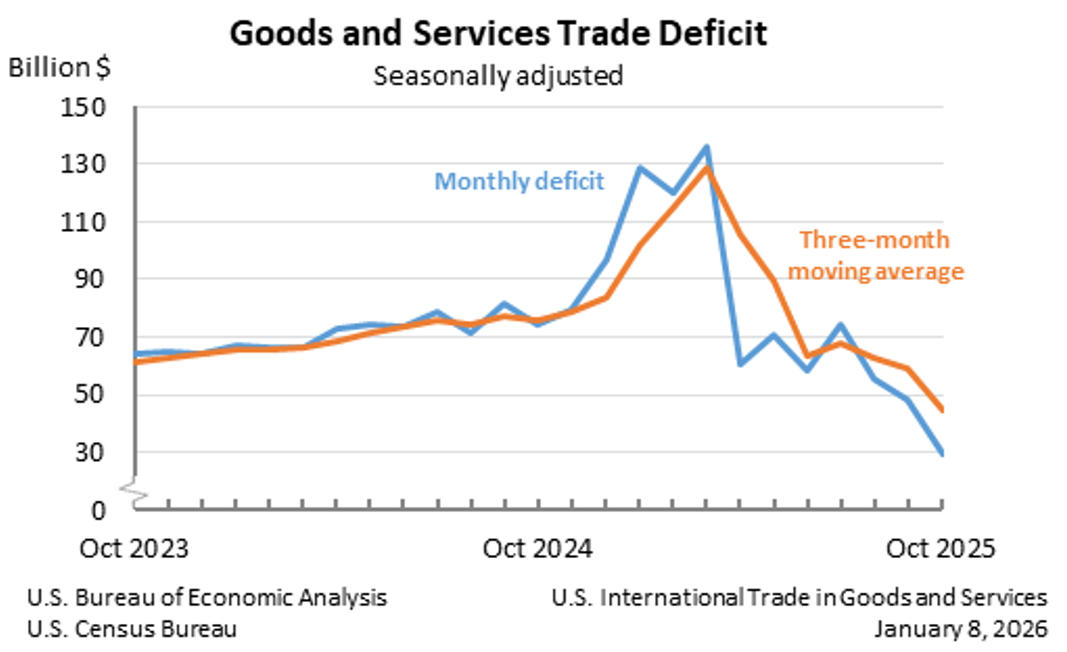
The U.S. goods and services trade deficit decreased in October 2025 according to the U.S. Bureau of Economic Analysis and the U.S. Census Bureau. The deficit decreased from $48.1 billion in September (revised) to $29.4 billion in October, as exports increased and imports decreased. The goods deficit decreased $19.2 billion in October to $59.1 billion. The services surplus decreased $0.4 billion in October to $29.8 billion.
Principal Federal Economic Indicators
Noteworthy


The Latest
U.S. International Trade in Goods and Services, Annual Revision
The U.S. monthly international trade deficit increased in April 2020 according to the U.S. Bureau of Economic Analysis and the U.S. Census Bureau. The deficit increased from $42.3 billion in March (revised) to $49.4 billion in April, as exports decreased more than imports. The previously published March deficit was $44.4 billion. The goods deficit increased $5.8 billion in April to $71.8 billion. The services surplus decreased $1.3 billion in…
U.S. International Trade in Goods and Services, April 2020
The U.S. monthly international trade deficit increased in April 2020 according to the U.S. Bureau of Economic Analysis and the U.S. Census Bureau. The deficit increased from $42.3 billion in March (revised) to $49.4 billion in April, as exports decreased more than imports. The previously published March deficit was $44.4 billion. The goods deficit increased $5.8 billion in April to $71.8 billion. The services surplus decreased $1.3 billion in…
Personal Income and Outlays, April 2020
Personal income increased 10.5 percent (monthly rate) in April according to estimates released today by the Bureau of Economic Analysis. Disposable personal income increased 12.9 percent and consumer spending decreased 13.6 percent.
Personal Income and Outlays: April 2020
Personal income increased 10.5 percent (monthly rate) in April according to estimates released today by the Bureau of Economic Analysis. Disposable personal income increased 12.9 percent and consumer spending decreased 13.6 percent.
Gross Domestic Product, First Quarter 2020
Real gross domestic product (GDP) decreased 5.0 percent in the first quarter of 2020, according to the “second” estimate released by the Bureau of Economic Analysis. The change was 0.2 percentage point lower than the “advance” estimate released in April. In the fourth quarter of 2019, real GDP increased 2.1 percent. For more information, see the Technical Note.
Gross Domestic Product, 1st Quarter 2020 (Second Estimate); Corporate Profits, 1st Quarter 2020 (Preliminary Estimate)
Real gross domestic product (GDP) decreased 5.0 percent in the first quarter of 2020, according to the “second” estimate released by the Bureau of Economic Analysis. The change was 0.2 percentage point lower than the “advance” estimate released in April. In the fourth quarter of 2019, real GDP increased 2.1 percent.
Table Changes Coming With Annual Update of International Statistics
In June, BEA will speed up and expand our statistics on U.S. international trade in services, including adding detail on some of the most dynamic services, such as research and development, intellectual property, and financial services.
Real Personal Income by Metropolitan Area, 2018
The percent change in real metropolitan area personal income ranged from 15.6 percent in Midland, TX to -1.1 percent in Sebring-Avon Park, FL.
Real Personal Income by State, 2018
The percent change in real state personal income ranged from 6.7 percent in Wyoming to 0.9 percent in Mississippi.
Real Personal Income by State and Metropolitan Area, 2018
Real state personal income grew 3.4 percent in 2018, after increasing 2.9 percent in 2017, according to estimates released today by the Bureau of Economic Analysis. Real state personal income is a state’s current-dollar personal income adjusted by the state’s regional price parity and the national personal consumption expenditures price index. The percent change in real state personal income ranged from 6.7 percent in Wyoming to 0.9 percent in…