
Bureau of Economic Analysis
U.S. International Transactions, 3rd Quarter 2025
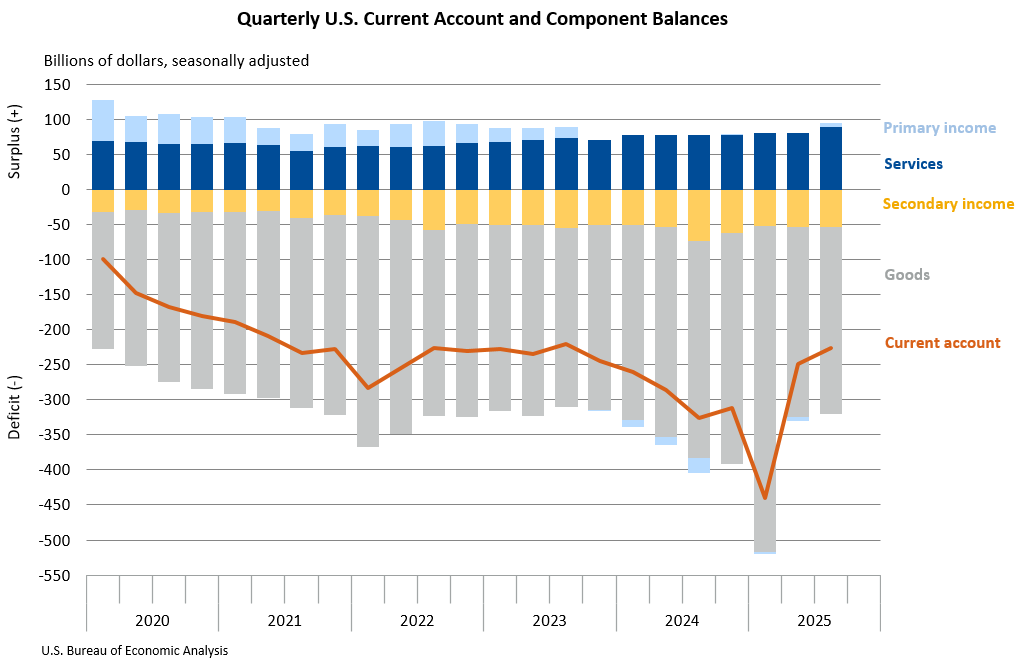
The U.S. current-account deficit narrowed by $22.8 billion, or 9.2 percent, to $226.4 billion in the third quarter of 2025, according to statistics released today by BEA. The revised second-quarter deficit was $249.2 billion. The third-quarter deficit was 2.9 percent of current-dollar gross domestic product, down from 3.3 percent in the second quarter.
Principal Federal Economic Indicators
Noteworthy


The Latest
Gross Domestic Product by Industry: Fourth Quarter and Year 2019
Retail trade, finance and insurance, and utilities were the leading contributors to the increase in U.S. economic growth in the fourth quarter of 2019. Overall, 17 of 22 industry groups contributed to the 2.1 percent increase in real GDP in the fourth quarter.
February 2020 Trade Gap is $39.9 Billion
The U.S. monthly international trade deficit decreased in February 2020 according to the U.S. Bureau of Economic Analysis and the U.S. Census Bureau. The deficit decreased from $45.5 billion in January (revised) to $39.9 billion in February, as imports decreased more than exports. The previously published January deficit was $45.3 billion. The goods deficit decreased $5.9 billion in February to $61.2 billion. The services surplus decreased $0…
U.S. International Trade in Goods and Services, February 2020
The U.S. monthly international trade deficit decreased in February 2020 according to the U.S. Bureau of Economic Analysis and the U.S. Census Bureau. The deficit decreased from $45.5 billion in January (revised) to $39.9 billion in February, as imports decreased more than exports. The previously published January deficit was $45.3 billion. The goods deficit decreased $5.9 billion in February to $61.2 billion. The services surplus decreased $0.4…
U.S. International Investment Position Year 2019
The U.S. net international investment position, the difference between U.S. residents’ foreign financial assets and liabilities, was –$10.99 trillion at the end of 2019, according to statistics released by the U.S. Bureau of Economic Analysis (BEA). Assets totaled $29.32 trillion and liabilities were $40.31 trillion. At the end of 2018, the net investment position was –$9.55 trillion.
U.S. International Investment Position Fourth Quarter 2019
The U.S. net international investment position, the difference between U.S. residents’ foreign financial assets and liabilities, was –$10.99 trillion at the end of the fourth quarter of 2019, according to statistics released by the U.S. Bureau of Economic Analysis (BEA). Assets totaled $29.32 trillion and liabilities were $40.31 trillion. At the end of the third quarter, the net investment position was –$10.98 trillion.
U.S. International Investment Position, Fourth Quarter and Year 2019
The U.S. net international investment position, the difference between U.S. residents’ foreign financial assets and liabilities, was –$10.99 trillion at the end of the fourth quarter of 2019, according to statistics released by the U.S. Bureau of Economic Analysis (BEA). Assets totaled $29.32 trillion and liabilities were $40.31 trillion. At the end of the third quarter, the net investment position was –$10.98 trillion.
Deputy Director Bohman Takes on Duties as Acting Director
The Bureau of Economic Analysis (BEA) announced today that Deputy Director Mary Bohman is the acting Director of the Bureau, overseeing the production of official economic statistics that provide a comprehensive, up-to-date picture of the U.S. economy.
Personal Income and Outlays, February 2020
Personal income increased 0.6 percent in February, the same increase as in January. Wages and salaries, the largest component of personal income, increased 0.5 percent in February, also the same increase as in January.
Personal Income and Outlays: February 2020
Personal income increased 0.6 percent in February, the same increase as in January. Wages and salaries, the largest component of personal income, increased 0.5 percent in February, also the same increase as in January.
GDP Increases in Fourth Quarter
Real gross domestic product increased 2.1 percent in the fourth quarter of 2019, according to the “third” estimate released by the Bureau of Economic Analysis. The growth rate is the same as in the “second” estimate released in February. In the third quarter, real GDP also increased 2.1 percent.