
News Release
Activities of U.S. Multinational Enterprises, 2017
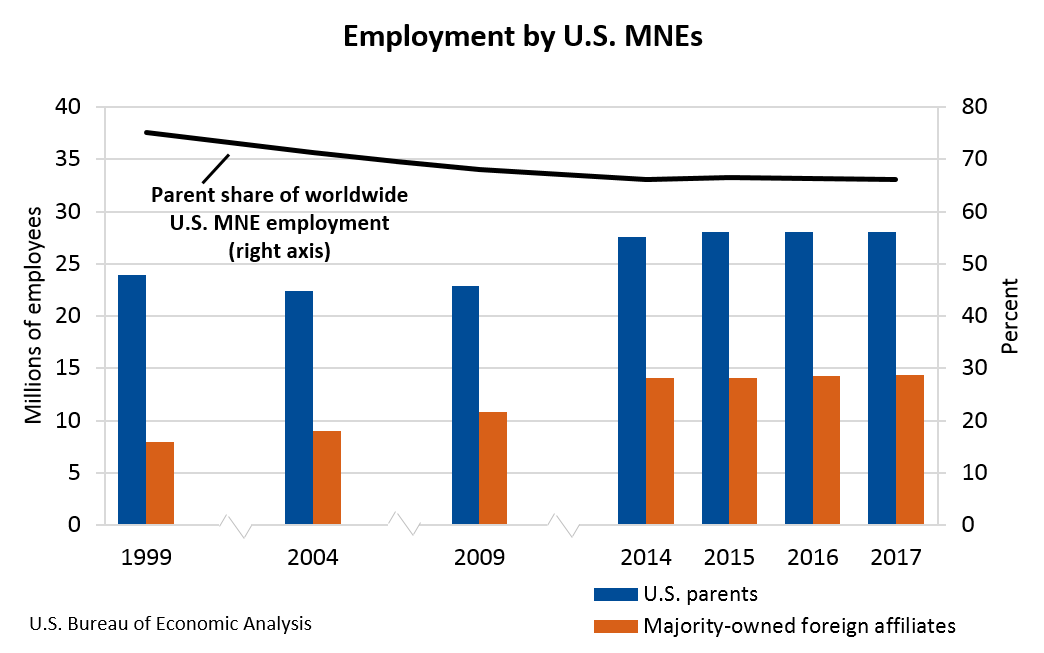
Worldwide employment by U.S. multinational enterprises (MNEs) increased 0.4 percent to 42.5 million workers in 2017 from 42.3 million in 2016, according to statistics released by the Bureau of Economic Analysis on the operations and finances of U.S. parent companies and their foreign affiliates.
Employment in the United States by U.S. parents increased 0.2 percent to 28.1 million workers in 2017. U.S. parents accounted for 66.1 percent of worldwide employment by U.S. MNEs, down from 66.3 percent in 2016. Employment abroad by majority-owned foreign affiliates (MOFAs) of U.S. MNEs increased 0.9 percent to 14.4 million workers and accounted for 33.9 percent of employment by U.S. MNEs worldwide.
U.S. parents accounted for 22.0 percent of total private industry employment in the United States. Employment by U.S. parents was largest in manufacturing and retail trade. Employment abroad by MOFAs was largest in China, United Kingdom, Mexico, India, and Canada.
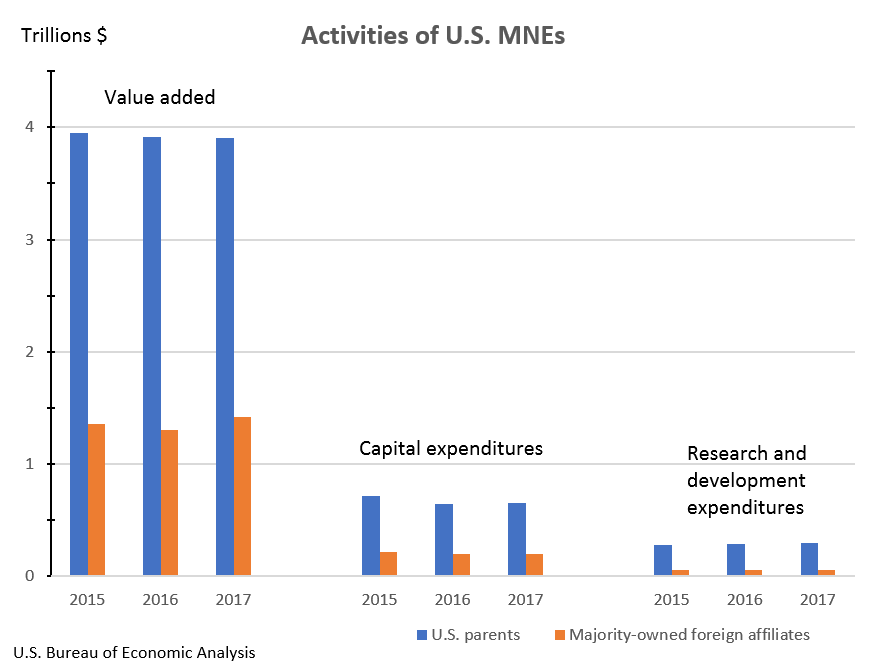
Worldwide current-dollar value added of U.S. MNEs increased 2.0 percent to $5.3 trillion. Value added by U.S. parents, a measure of their direct contribution to U.S. gross domestic product, was nearly unchanged at $3.9 trillion, representing 22.9 percent of total U.S. private-industry value added. MOFA value added increased to $1.4 trillion. Value added by MOFAs was largest in the United Kingdom, Canada, and Ireland.
Worldwide expenditures for property, plant, and equipment of U.S. MNEs increased 2.0 percent to $853.2 billion. Expenditures by U.S. parents accounted for $653.6 billion and MOFA expenditures for $199.6 billion.
Worldwide research and development expenditures of U.S. MNEs increased 3.3 percent to $354.9 billion. U.S. parents accounted for expenditures of $298.3 billion and MOFAs for $56.6 billion.
Additional statistics on the activities of U.S. parent companies and their foreign affiliates including sales, balance sheet and income statement items, compensation of employees, trade in goods, and more are available on BEA’s website. More industry detail for U.S. parents and more industry and country detail for foreign affiliates are also available on the website and will be published in the September issue of the Survey of Current Business.
Updates to the statistics
Statistics for 2016 are revised to incorporate newly available and revised source data. Preliminary statistics for 2016 were released in August 2018 and highlighted in “Activities of U.S. Multinational Enterprises in 2016” in the September 2018 issue of the Survey of Current Business.
| U.S. Parents | MOFAs | |||
| Preliminary estimate |
Revised estimate |
Preliminary estimate |
Revised estimate |
|
|---|---|---|---|---|
| Number of employees (thousands) | 28,022.9 | 28,022.6 | 14,256.1 | 14,265.4 |
| Value added | 3,925.7 | 3,916.2 | 1,300.4 | 1,302.1 |
| Expenditures for property, plant, and equipment | 657.5 | 641.5 | 199.5 | 195.1 |
| Research and development expenditures | 296.9 | 289.4 | 53.5 | 54.3 |
Activities of U.S. Multinational Enterprises, 2018