
News Release
U.S. International Transactions, Third Quarter 2019
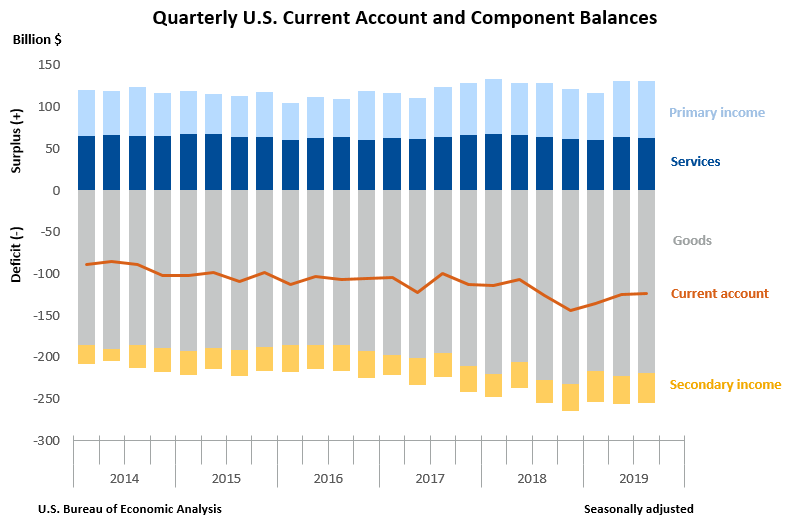
Current Account Deficit Narrows by 0.9 Percent in Third Quarter
The U.S. current account deficit, which reflects the combined balances on trade in goods and services and income flows between U.S. residents and residents of other countries, narrowed by $1.1 billion, or 0.9 percent, to $124.1 billion in the third quarter of 2019, according to statistics from the U.S. Bureau of Economic Analysis (BEA). The revised second quarter deficit was $125.2 billion.
The third quarter deficit was 2.3 percent of current dollar gross domestic product, down less than 0.1 percent from the second quarter.
The $1.1 billion narrowing of the current account deficit in the third quarter mainly reflected a reduced deficit on goods and an expanded surplus on primary income.
Current Account Transactions (tables 1-5)
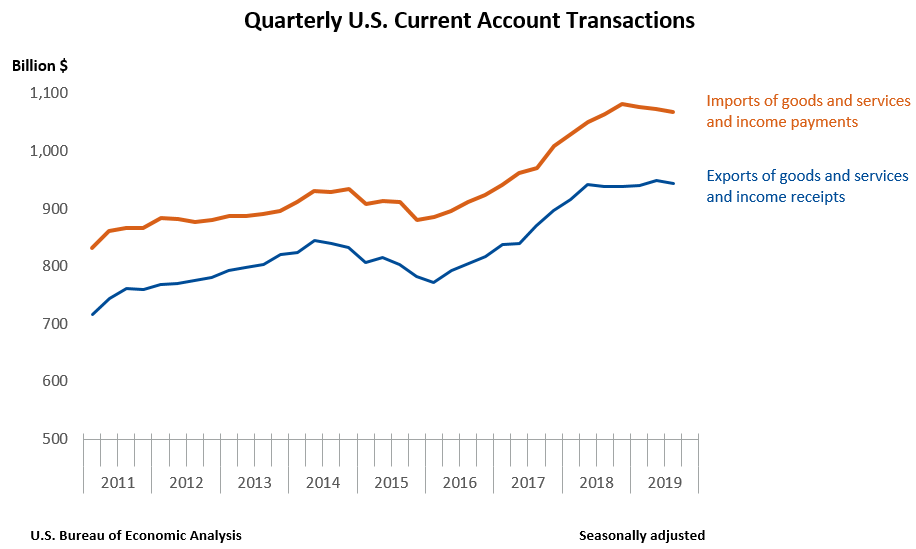
Exports of goods and services to, and income received from, foreign residents decreased $4.3 billion, to $944.4 billion, in the third quarter. Imports of goods and services from, and income paid to, foreign residents decreased $5.4 billion, to $1.07 trillion.
Trade in Goods (table 2)
Exports of goods decreased $0.9 billion, to $413.8 billion, and imports of goods decreased $4.5 billion, to $633.4 billion. The decreases in both exports and imports mainly reflected decreases in industrial supplies and materials, primarily petroleum and products.
Trade in Services (table 3)
Exports of services decreased $0.3 billion, to $212.0 billion, reflecting partly offsetting changes across major categories. Decreases were led by travel, mainly other personal travel, and increases were led by other business services, mainly professional and management consulting services. Imports of services increased $1.6 billion, to $149.8 billion, reflecting increases in nearly all major categories. Increases were led by insurance services, mainly reinsurance.
Primary Income (table 4)
Receipts of primary income decreased $4.1 billion, to $282.0 billion, and payments of primary income decreased $6.2 billion, to $213.3 billion. The decreases in both receipts and payments mainly reflected decreases in direct investment income and in other investment income. Within direct investment income receipts, dividends increased $24.9 billion, to $95.3 billion, in the third quarter and remain elevated since the passage of the 2017 Tax Cuts and Jobs Act, which generally eliminated taxes on repatriated earnings beginning in 2018. For more information, see “How do the effects of the 2017 Tax Cuts and Jobs Act appear in BEA’s direct investment statistics?” The decreases in other investment income receipts and payments mainly reflected decreases in interest on loans and deposits.
Secondary Income (table 5)
Receipts of secondary income increased $1.0 billion, to $36.6 billion, mainly reflecting an increase in private sector fines and penalties, a component of private transfer receipts. Payments of secondary income increased $3.7 billion, to $72.0 billion, mainly reflecting increases in U.S. government grants and in insurance-related transfers, a component of private transfer payments.
Financial Account Transactions (tables 1, 6, 7, and 8)
Net financial account transactions were −$47.9 billion in the third quarter, reflecting net U.S. borrowing from foreign residents.
Financial Assets (tables 1, 6, 7, and 8)
Third quarter transactions increased U.S. residents’ foreign financial assets by $123.5 billion. Transactions increased direct investment assets, primarily equity, by $33.3 billion; portfolio investment assets, mainly debt securities, by $18.5 billion; other investment assets, primarily loans, by $69.9 billion; and reserve assets by $1.9 billion.
Liabilities (tables 1, 6, 7, and 8)
Third quarter transactions increased U.S. liabilities to foreign residents by $164.9 billion. Transactions increased direct investment liabilities, mainly equity, by $37.6 billion; portfolio investment liabilities, mainly debt securities, by $86.5 billion; and other investment liabilities, mainly bank deposits, by $40.8 billion.
Financial Derivatives (table 1)
Net transactions in financial derivatives were −$6.5 billion in the third quarter, reflecting net borrowing from foreign residents.
| Updates to Second Quarter 2019 International Transactions Accounts Balances Billions of dollars, seasonally adjusted |
||
| Preliminary estimate | Revised estimate | |
|---|---|---|
| Current account balance | −128.2 | −125.2 |
| Goods balance | −223.3 | −223.2 |
| Services balance | 60.0 | 64.1 |
| Primary income balance | 67.6 | 66.6 |
| Secondary income balance | −32.5 | −32.7 |
| Net financial account transactions | −155.1 | −213.4 |
Prototype Tables
With the release of the international transactions accounts (ITAs) on September 19, 2019, BEA introduced two new tables that present: (1) geographic detail by type of transaction (ITA table 1.4) and (2) annual trade in goods and services with expanded country and geographic area detail (ITA table 1.5). These tables were released as prototypes, along with prototypes for the other standard ITA tables that reflect changes that will be introduced with the annual update in June 2020. These prototype tables have been updated to incorporate the statistics from this release and continue to be provided alongside the current standard presentation to prepare data users for the upcoming changes. The two sets of tables will be published concurrently until June 2020, when the prototype tables will replace the existing tables as the standard presentation. The prototype tables, published as addenda to the current tables, are available in BEA’s interactive data application. Additional information is available in “Prototype Tables for the International Transactions Accounts.”
* * *
Next release: March 19, 2020 at 8:30 A.M. EDT
U.S. International Transactions, Fourth Quarter and Year 2019
* * *
U.S. International Transactions Release Dates in 2020
| Fourth Quarter and Year 2019 | March 19 |
| First Quarter 2020 and Annual Update | June 19 |
| Second Quarter 2020 | September 18 |
| Third Quarter 2020 | December 18 |