
News Release
U.S. International Transactions, First Quarter 2020 and Annual Update
Current Account Deficit Narrows by 0.1 Percent in First Quarter
Current Account Balance, First Quarter
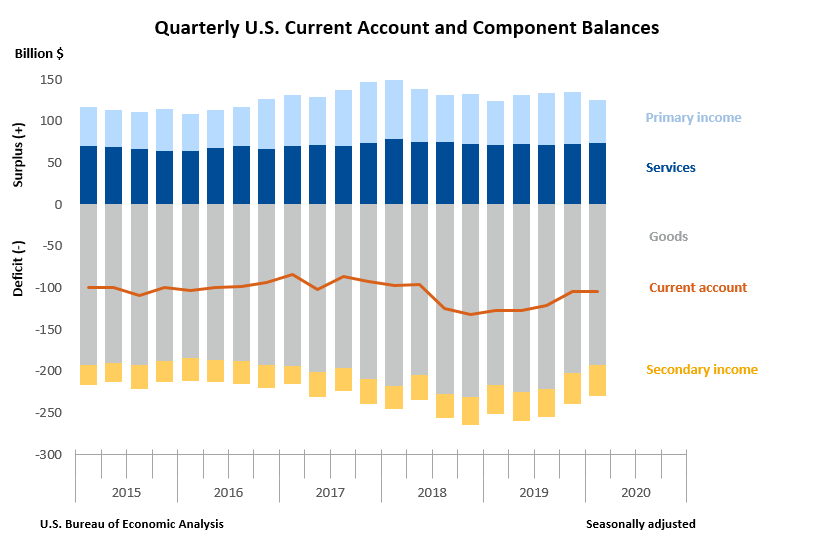
The U.S. current account deficit, which reflects the combined balances on trade in goods and services and income flows between U.S. residents and residents of other countries, narrowed by $0.1 billion, or 0.1 percent, to $104.2 billion in the first quarter of 2020, according to statistics from the U.S. Bureau of Economic Analysis (BEA). The revised fourth quarter deficit was $104.3 billion.
The first quarter deficit was 1.9 percent of current dollar gross domestic product, up less than 0.1 percentage point from the fourth quarter.
The $0.1 billion narrowing of the current account deficit in the first quarter mainly reflected a reduced deficit on goods that was largely offset by a reduced surplus on primary income and an expanded deficit on secondary income.
Current Account Transactions (tables 1-5)
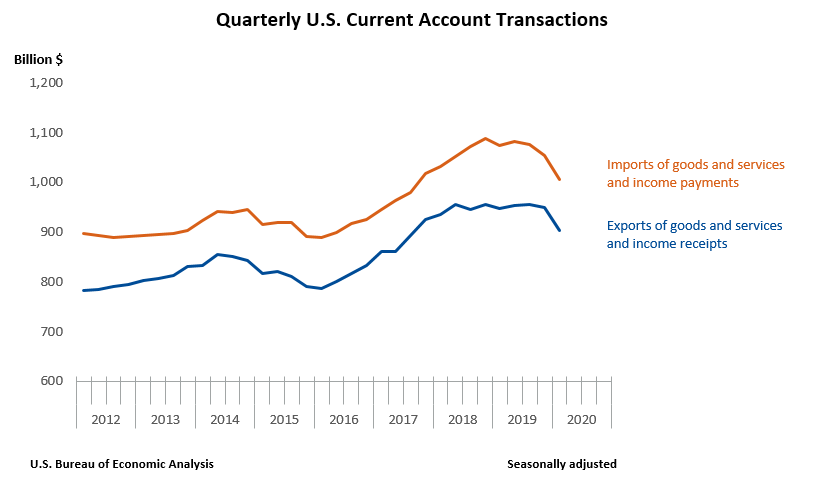
Exports of goods and services to, and income received from, foreign residents decreased $47.5 billion, to $902.3 billion, in the first quarter. Imports of goods and services from, and income paid to, foreign residents decreased $47.7 billion, to $1.01 trillion.
Trade in Goods (table 2)
Exports of goods decreased $8.4 billion, to $403.0 billion, mostly reflecting decreases in capital goods, mainly civilian aircraft, and in consumer goods, mainly jewelry and collectibles. Imports of goods decreased $18.6 billion, to $595.3 billion, mostly reflecting decreases in consumer goods, mainly cell phones and other household goods, and in capital goods, mainly computers, telecommunications equipment, and other industrial machinery.
Trade in Services (table 3)
Exports of services decreased $11.7 billion, to $209.4 billion, and imports of services decreased $12.2 billion, to $136.1 billion. The decreases in both exports and imports mainly reflected decreases in travel, primarily other personal travel, and in transport, primarily air passenger transport.
Primary Income (table 4)
Receipts of primary income decreased $27.8 billion, to $255.1 billion, and payments of primary income decreased $18.3 billion, to $202.7 billion. The decreases in both receipts and payments mostly reflected decreases in direct investment income, mainly earnings.
Secondary Income (table 5)
Receipts of secondary income increased $0.3 billion, to $34.8 billion, and payments of secondary income increased $1.5 billion, to $72.4 billion. The increases in both receipts and payments mainly reflected increases in private transfers, primarily private sector fines and penalties.
Capital Account Transactions (table 1)
Capital transfer payments increased $0.9 billion, to $3.0 billion in the first quarter, primarily reflecting an increase in investment grants.
Financial Account Transactions (tables 1, 6, 7, and 8)
Net financial account transactions were −$201.1 billion in the first quarter, reflecting net U.S. borrowing from foreign residents.
Financial Assets (tables 1, 6, 7, and 8)
First quarter transactions increased U.S. residents’ foreign financial assets by $722.7 billion. Transactions increased portfolio investment assets by $144.7 billion, resulting from large and partly offsetting transactions in equity securities and debt securities, and other investment assets, mostly currency and deposits, by $614.6 billion. Transactions in deposits included $353.9 billion in foreign currency acquired by the Federal Reserve System from central bank liquidity swaps with foreign central banks. Transactions decreased direct investment assets, mostly debt instruments, by $36.3 billion, and reserve assets by $0.2 billion.
Liabilities (tables 1, 6, 7, and 8)
First quarter transactions increased U.S. liabilities to foreign residents by $902.0 billion. Transactions increased direct investment liabilities, mainly equity, by $47.8 billion; portfolio investment liabilities by $21.3 billion, resulting from large and mostly offsetting transactions in equity securities and debt securities; and other investment liabilities, mostly currency and deposits and loans, by $832.9 billion. Transactions in deposits included $387.3 billion in interbank deposits received by the U.S. branches of foreign banks from affiliated foreign banks. These were mainly the U.S. dollars that foreign central banks obtained through the swaps described in the assets section above, which they then lent to foreign banks.
Financial Derivatives (table 1)
Net transactions in financial derivatives were −$21.8 billion in the first quarter, reflecting net borrowing from foreign residents.
|
Updates to Fourth Quarter 2019 International Transactions Accounts Balances Billions of dollars, seasonally adjusted |
||
| Preliminary estimate | Revised estimate | |
|---|---|---|
| Current account balance | -109.8 | −104.3 |
| Goods balance | −202.8 | −202.5 |
| Services balance | 62.9 | 72.7 |
| Primary income balance | 67.3 | 62.0 |
| Secondary income balance | −37.3 | −36.5 |
| Net financial account transactions | −71.8 | −29.3 |
Annual Update of the International Transactions Accounts (table 9)
The statistics in this release reflect the annual update of the U.S. international transactions accounts (ITAs). With this update, BEA has incorporated newly available and revised source data, changes in definitions and classifications, methodological and source data improvements, and updated seasonal adjustments. In addition, table presentations for the ITAs have been expanded to provide additional detail. Statistics are revised for the first quarter of 1999 to the fourth quarter of 2019.
Key changes introduced in this annual update are summarized below. Additional information on these changes is published in “Preview of the 2020 Annual Update of the International Economic Accounts” in the April 2020 issue of the Survey of Current Business. An article describing the revisions to the statistics will be published in the July 2020 issue.
Expanded trade in services statistics
- Expanded quarterly geographic detail on trade in services from 38 to 90 countries and geographic areas
- Introduction of measures of two implicitly priced financial services—financial intermediation services indirectly measured (FISIM) and margins on buying and selling—and additional subcategory detail for financial services
- Expansion of major services categories from nine to twelve categories to more closely align with international guidelines. The new categories are:
- Construction, which was previously a component of other business services.
- Personal, cultural, and recreational services, which consists of transactions that were previously classified in charges for the use of intellectual property n.i.e. (not included elsewhere) and other business services.
- Manufacturing services on physical inputs owned by others, which is a specific form of “contract manufacturing.” Data to estimate these services are not yet available; the category acts as a placeholder for future statistics.
- Improved classification of services categories, particularly intellectual property-related transactions, to align with international standards
Methodological and source data improvements and other reclassifications
- Improvements to estimation procedures for statistics that are based on BEA services surveys, including maintenance and repair services; construction; insurance services; financial services; charges for the use of intellectual property; telecommunications, computer, and information services; other business services; and personal, cultural, and recreational services
- Incorporation of the results of the 2017 Benchmark Survey of Selected Services and Intellectual Property Transactions with Foreign Persons
- Improved methodology and source data for transport services, particularly air passenger services, air freight and port services, and sea freight and port services
- Improved methodology and source data for all subcomponents of travel services
- Improved traveler visa counts also resulted in revisions to compensation of employees, a component of primary income, and to private transfer payments, a component of secondary income
- Other improvements to secondary income, including new data on foreign gifts to U.S. universities, which resulted in revisions to secondary income receipts, and improved methodology for personal transfers payments
- FISIM-related improvements to the methodology for other investment interest income to ensure that the service component of interest is included in trade rather than income, as well as new addenda items for interest before adjustment for FISIM
- Improved methodology for portfolio investment interest income payments to include income from inflation adjustments associated with U.S. Treasury Inflation Protected Securities
- Expansion of the capital account to include:
- Investment grants, which have been reclassified from secondary income
- Outright sales and purchases of trademarks and franchise fees, which have been reclassified from charges for the use of intellectual property n.i.e.
- Improved coverage of fees paid by sporting franchises for the transfer of players
- Reclassification of certain U.S. government capital subscriptions or other contributions to international organizations from loan assets to a new category, other equity assets, in the other investment assets functional category in the financial account and incorporation of newly identified U.S. government transactions in other equity assets and loan assets
Other presentational improvements
- New subcategory detail for secondary income in ITA table 5.1
- New standard ITA tables that present geographic detail
- Table 1.4. U.S. International Transactions, Geographic Detail by Type of Transaction
- Table 1.5. U.S. International Trade in Goods and Services by Area and Country
- Consistency in country and geographic presentations across international data products
* * *
September 18, 2020 at 8:30 A.M. EDT
U.S. International Transactions, Second Quarter 2020