
News Release
U.S. International Investment Position, Fourth Quarter and Year 2021
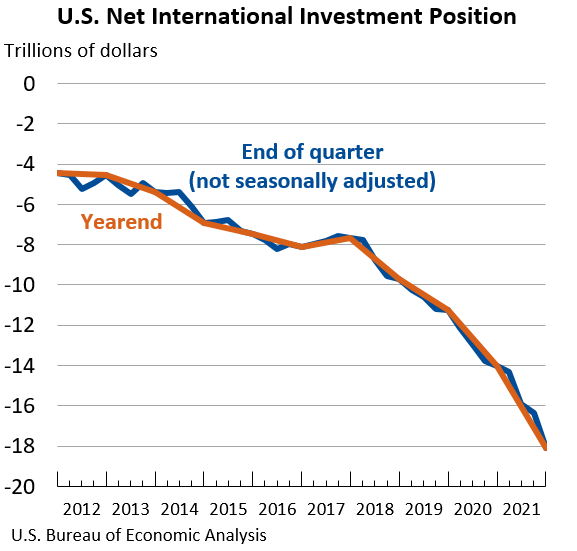
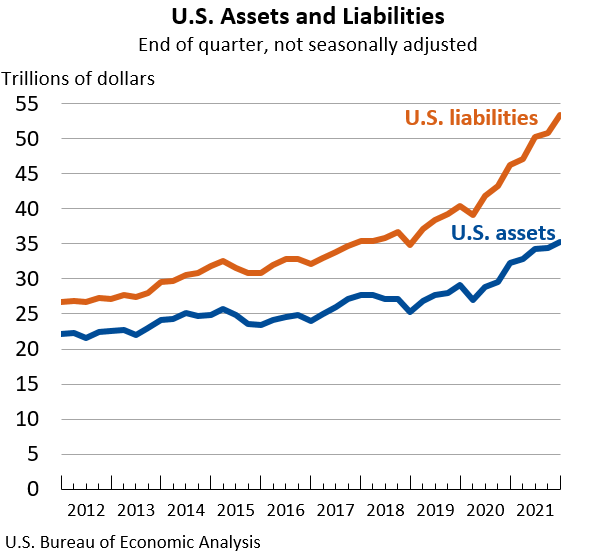
The U.S. net international investment position (IIP), the difference between U.S. residents’ foreign financial assets and liabilities, was –$18.10 trillion at the end of the fourth quarter of 2021, according to statistics released today by the U.S. Bureau of Economic Analysis (BEA). Assets totaled $35.21 trillion, and liabilities were $53.31 trillion. At the end of the third quarter, the net investment position was –$16.35 trillion. The net investment positions and components of assets and liabilities are presented in table 1.
The –$1.75 trillion change in the net investment position from the third quarter to the fourth quarter came from net financial transactions of –$153.0 billion and net other changes in position, such as price and exchange-rate changes, of –$1.60 trillion that mostly reflected U.S. stock price increases that exceeded foreign stock price increases, which increased U.S. liabilities more than U.S. assets (table A).
Table A. Quarterly Change in the U.S. Net International Investment Position
Billions of dollars, not seasonally adjusted
| End of quarter position, 2021:Q3 |
Change in position in 2021:Q4 | End of quarter position, 2021:Q4 |
|||
| Total | Attributable to: | ||||
| Financial transactions |
Other changes in position 1 |
||||
| U.S. net international investment position | -16,351.2 | -1,749.9 | -153.0 | -1,596.9 | -18,101.2 |
| Net position excluding financial derivatives | -16,384.7 | -1,736.0 | -130.1 | -1,605.9 | -18,120.7 |
| Financial derivatives other than reserves, net | 33.5 | -13.9 | -22.9 | 9.0 | 19.6 |
| U.S. assets | 34,431.5 | 779.2 | (2) | (2) | 35,210.7 |
| Assets excluding financial derivatives | 32,385.0 | 837.7 | 91.9 | 745.8 | 33,222.7 |
| Financial derivatives other than reserves | 2,046.5 | -58.5 | (2) | (2) | 1,988.0 |
| U.S. liabilities | 50,782.7 | 2,529.1 | (2) | (2) | 53,311.9 |
| Liabilities excluding financial derivatives | 48,769.7 | 2,573.8 | 222.0 | 2,351.7 | 51,343.5 |
| Financial derivatives other than reserves | 2,013.0 | -44.6 | (2) | (2) | 1,968.4 |
|
1. Disaggregation of other changes in position into price changes, exchange-rate changes, and other changes in volume and valuation is presented for annual statistics (see table B and table 2 in this release). 2. Financial transactions and other changes in financial derivatives positions are available on a net basis; they are not separately available for U.S. assets and U.S. liabilities. |
|||||
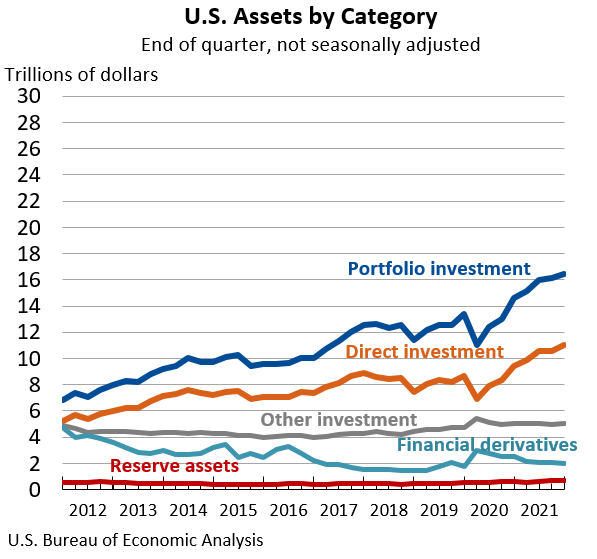
U.S. assets increased by $779.2 billion to a total of $35.21 trillion at the end of the fourth quarter, mostly reflecting increases in direct investment and portfolio investment assets. Direct investment assets increased by $498.7 billion to $11.03 trillion and portfolio investment assets increased by $265.6 billion to $16.42 trillion, driven mainly by increases in foreign stock prices that raised the value of these assets.
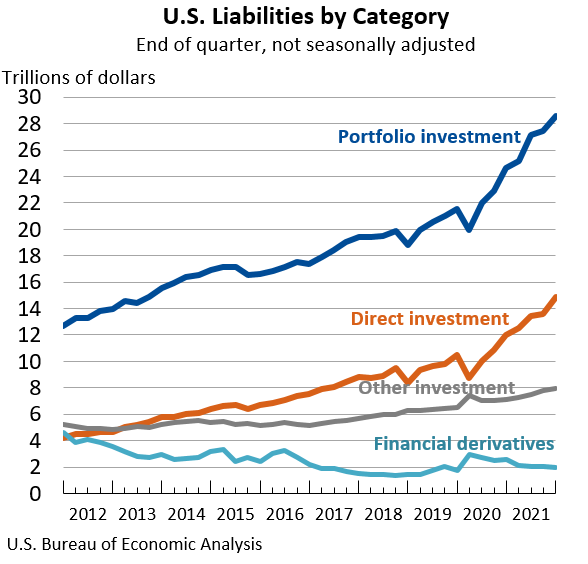
U.S. liabilities increased by $2.53 trillion to a total of $53.31 trillion at the end of the fourth quarter, mostly reflecting increases in direct investment and portfolio investment liabilities. Direct investment liabilities increased by $1.27 trillion to $14.84 trillion and portfolio investment liabilities increased by $1.16 trillion to $28.59 trillion, driven mainly by increases in U.S. stock prices that raised the value of these liabilities.
Updates to Third–Quarter 2021 International Investment Position Aggregates
Trillions of dollars, not seasonally adjusted
| Preliminary estimate | Revised estimate | |
|---|---|---|
| U.S. net international investment position | –16.07 | –16.35 |
| U.S. assets | 34.45 | 34.43 |
| U.S. liabilities | 50.53 | 50.78 |
Year 2021
The U.S. net international investment position was –$18.10 trillion at the end of 2021, compared to –$14.01 trillion at the end of 2020. The net investment positions and components of assets and liabilities are presented in table 2.
The –$4.09 trillion change in the net investment position from the end of 2020 to the end of 2021 came from net financial transactions of –$687.1 billion and net other changes in position, such as price and exchange-rate changes, of –$3.40 trillion (table B). Price changes of –$1.81 trillion mostly reflected U.S. stock price increases that exceeded foreign stock price increases, which increased U.S. liabilities more than U.S. assets. Exchange-rate changes of –$953.2 billion reflected the depreciation of major foreign currencies against the U.S. dollar, which lowered the value of foreign-currency-denominated assets in dollar terms. Changes in volume and valuation n.i.e. (not included elsewhere) of –$704.1 billion reflected a series break in the long-term securities data resulting from data revisions by respondents on the monthly Treasury International Capital SLT report for June 2021. For more information, see footnote 5 under “Footnotes and Notices” on “Securities (B): Portfolio Holdings of U.S. and Foreign Securities | U.S. Department of the Treasury.”
U.S. assets increased by $2.95 trillion to a total of $35.21 trillion at the end of 2021, mostly reflecting increases in portfolio investment and direct investment assets that were partly offset by a decrease in financial derivatives. Portfolio investment assets increased by $1.82 trillion to $16.42 trillion and direct investment assets increased by $1.63 trillion to $11.03 trillion, driven mainly by foreign stock price increases and, to a lesser extent, by financial transactions that mostly reflected U.S. purchases of long-term debt securities and increases in direct investment equity assets. The impact of foreign stock price increases and financial transactions was partly offset by decreases resulting from the depreciation of major foreign currencies against the U.S. dollar, which lowered the value of foreign-currency-denominated assets in dollar terms. Financial derivatives decreased $557.8 billion to $1.99 trillion, driven by decreases in single-currency interest rate contracts.
Table B. Annual Change in the U.S. Net International Investment Position
Billions of dollars
| Yearend position, 2020 |
Change in position in 2021 | Yearend position, 2021 |
|||||||
| Total | Attributable to: | ||||||||
| Financial transactions |
Other changes in position | ||||||||
| Total | Price changes | Exchange-rate changes | Changes in volume and valuation n.i.e |
||||||
| U.S. net investment position | -14,011.2 | -4,089.9 | -687.1 | -3,402.8 | (1) | (1) | (1) | -18,101.2 | |
| Net position excl. derivatives | -14,004.6 | -4,116.1 | -645.4 | -3,470.7 | -1,813.4 | -953.2 | -704.1 | -18,120.7 | |
| Financial derivatives, net | -6.6 | 26.2 | -41.7 | 67.9 | (1) | (1) | (1) | 19.6 | |
| U.S. assets | 32,256.3 | 2,954.4 | (2) | (2) | (2) | (2) | (2) | 35,210.7 | |
| Assets excl. derivatives | 29,710.6 | 3,512.1 | 1,213.3 | 2,298.8 | 3,134.8 | -1,036.4 | 200.4 | 33,222.7 | |
| Financial derivatives | 2,545.7 | -557.8 | (2) | (2) | (2) | (2) | (2) | 1,988.0 | |
| U.S. liabilities | 46,267.6 | 7,044.3 | (2) | (2) | (2) | (2) | (2) | 53,311.9 | |
| Liabilities excl. derivatives | 43,715.2 | 7,628.2 | 1,858.8 | 5,769.5 | 4,948.2 | -83.2 | 904.5 | 51,343.5 | |
| Financial derivatives | 2,552.4 | -584.0 | (2) | (2) | (2) | (2) | (2) | 1,968.4 | |
|
1. Data are not separately available for price changes, exchange-rate changes, and changes in volume and valuation n.i.e. (not included elsewhere). 2. Financial transactions and other changes in financial derivatives positions are available on a net basis; they are not separately available for U.S. assets and U.S. liabilities. |
|||||||||
U.S. liabilities increased by $7.04 trillion to a total of $53.31 trillion at the end of 2021, reflecting increases in all major categories of liabilities except financial derivatives. Portfolio investment liabilities increased by $3.96 trillion to $28.59 trillion and direct investment liabilities increased by $2.86 trillion to $14.84 trillion, driven mainly by U.S. stock price increases and, to a lesser extent, by financial transactions that mostly reflected foreign purchases of long-term debt securities and increases in direct investment equity liabilities. Other investment liabilities increased $807.9 billion to $7.92 trillion, mostly reflecting U.S. borrowing in the form of loans and deposits. In contrast, financial derivatives decreased by $584.0 billion to $1.97 trillion, driven by decreases in single-currency interest rate contracts.
Upcoming Update to the U.S. International Investment Position
The annual update of the U.S. International Investment Position (IIP) Accounts, along with preliminary estimates for the first quarter of 2022, will be released on June 28, 2022. With the annual update, BEA will update the two new IIP tables 2.2 and 4.1, which were introduced in the IIP release on December 30, 2021, and add them to the existing standard IIP table presentation. Table 2.2 will be expanded to include data on foreign special purpose entities. To prepare data users for these changes, BEA has provided two prototype tables, described below, with this release in BEA’s Interactive Data Application. More information will be available in a preview article on BEA’s annual update of the International Economic Accounts in the April 2022 Survey of Current Business.
Prototype Tables
IIP table 2.2 features annual statistics on direct investment positions in special purpose entities (SPEs), which are legal entities with little or no employment or physical presence. The increased prevalence of SPEs heightens the need for separate statistics on their activities for analysis and for improved interpretability of macroeconomic statistics. For more information, see “Special Purpose Entities in the International Investment Position Accounts.”
IIP table 4.1 features quarter-end position statistics on U.S. debt positions by currency, sector, and maturity for U.S. assets and liabilities. These statistics are valuable for assessing U.S. exposure to foreign currency risks and for helping to identify potential future financial crises. For more information, see “New Statistics on U.S. Debt Positions in the International Investment Position Accounts."
* * *
Next release: June 28, 2022, at 8:30 a.m. EDT
U.S. International Investment Position, First Quarter 2022 and Annual Update
* * *