
News Release
New Foreign Direct Investment in the United States, 2022
Expenditures by foreign direct investors to acquire, establish, or expand U.S. businesses totaled $177.5 billion (preliminary) in 2022, according to statistics released today by the U.S. Bureau of Economic Analysis (BEA). Expenditures decreased $185.1 billion, or 51 percent, from $362.6 billion (revised) in 2021 and were below the annual average of $298.8 billion for 2014–2021. As in previous years, acquisitions of existing businesses accounted for most of total expenditures.
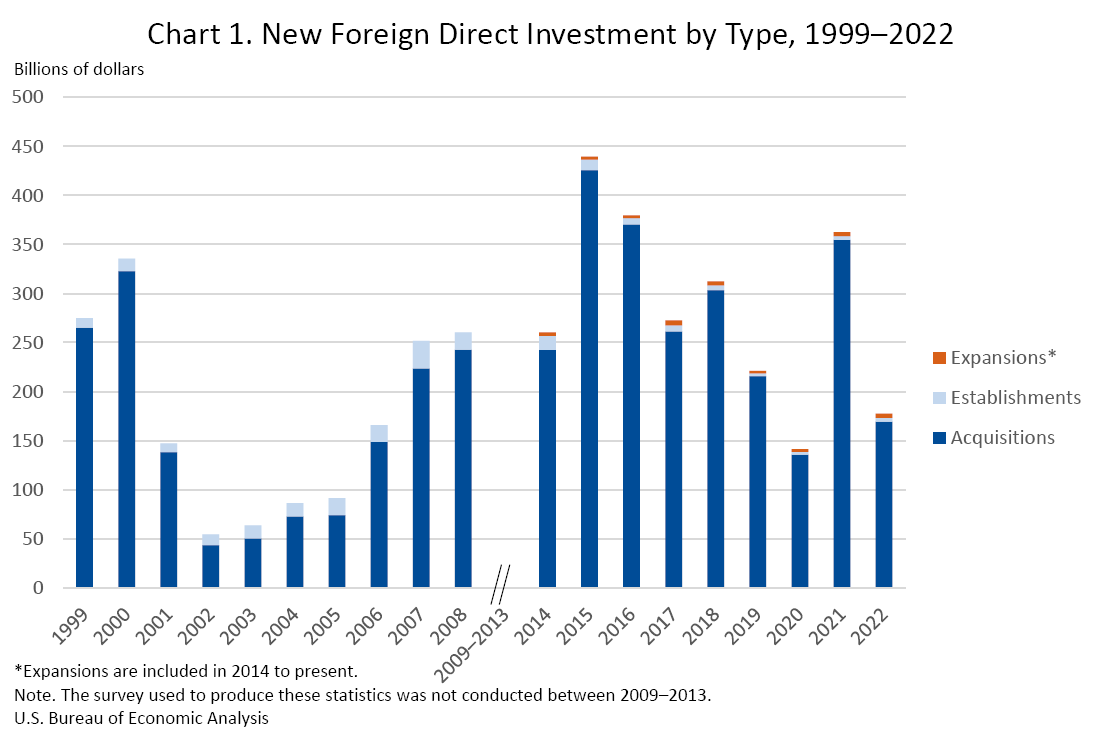
In 2022, expenditures for acquisitions were $169.4 billion, expenditures to establish new U.S. businesses were $3.8 billion, and expenditures to expand existing foreign-owned businesses were $4.4 billion. Planned total expenditures, which include both first-year and planned future expenditures, were $255.1 billion (table 1.2).
Expenditures by industry, country, and state (tables 1.2, 2.2, and 3.2)
By industry, expenditures for new direct investment were largest in the manufacturing sector, at $55.2 billion, accounting for 31.1 percent of total expenditures. Within manufacturing, expenditures were largest in chemical manufacturing ($21.5 billion) and machinery ($9.9 billion). There were also notable expenditures in the information sector ($28.2 billion).
By country of ultimate beneficial owner (UBO), the largest investing country was Canada, with expenditures of $37.9 billion. The United Kingdom ($34.7 billion) was the second-largest country, followed by France ($16.5 billion). By region, Europe contributed 57.4 percent of new investment in 2022.
By state, California received the most investment, totaling $29.0 billion, followed by Texas ($20.7 billion) and Illinois ($10.9 billion).
Greenfield expenditures (tables 1.2, 2.2, and 3.2)
Greenfield investment expenditures—expenditures to either establish a new U.S. business or to expand an existing foreign-owned U.S. business—were $8.1 billion in 2022. By industry, greenfield expenditures were largest in manufacturing, totaling $5.3 billion, led by computer and electronic products ($1.8 billion). By region of UBO, Asia and Pacific ($3.4 billion) and Europe ($2.9 billion) had the largest expenditures. By state, California received the highest level of greenfield investment ($1.5 billion).
Total planned expenditures for greenfield investment initiated in 2022, which include both first-year and future expenditures, were $85.7 billion. By industry, total planned expenditures for greenfield investment were largest in semiconductors and other components manufacturing and in electrical equipment, appliances, and components manufacturing, which includes batteries. By region of UBO, Asia and Pacific had the largest total planned expenditures. By U.S. region, the Southwest had the largest total planned expenditures.
Employment by newly acquired, established, or expanded foreign-owned businesses (tables 4.2, 5.2, and 6.2)
In 2022, employment at newly acquired, established, or expanded foreign-owned businesses in the United States was 142,700 employees. Current employment of acquired enterprises was 139,000. Total planned employment, which includes the current employment of acquired enterprises, the planned employment of newly established business enterprises when fully operational, and the planned employment associated with expansions, was 185,600.
By industry, manufacturing accounted for the largest number of employees (34,800), followed by professional, scientific, and technical services (18,400). By country of UBO, Canada (34,300), the United Kingdom (22,800), and France (11,000) accounted for the largest number of employees.
By state, California and Florida had the largest employment resulting from new investment (13,400 each), followed by Texas (13,300) and Illinois (11,200). See Improvements to the New Foreign Direct Investment Statistics below.
Today's release incorporates an improved methodology for estimating employment at the state level by U.S. businesses newly acquired by foreign investors.
For the largest acquisitions—those with 3,000 or more employees—that are more likely to involve operations in multiple states, BEA now uses the U.S. Bureau of Labor Statistics Quarterly Census of Employment and Wages establishment-level data to assign employees to the states where they work more accurately than is possible using BEA survey data alone.
For more information, please see U.S. International Economics Accounts: Concepts and Methods and "Upcoming Improvements to BEA's Statistics on New Foreign Direct Investment in the United States" in the Survey of Current Business.
This methodological improvement is part of a broader BEA fiscal year 2023 funded initiative to measure global supply chains.
Separately, BEA changed the reporting requirements for respondents that must provide annual expenditure updates for multiyear establishment or expansion projects. Previously, BEA collected these updates annually until the project was completed. They will now be collected and compiled for 3 years after the year in which the investment was initiated, or until the project was completed, whichever comes first. This change reduces respondent burden but still allows BEA to continue to produce reliable statistics that can help answer questions about whether greenfield projects are completed and whether there are significant differences between planned and actual costs.
| Previously Published Estimate | Revised Estimate | |
|---|---|---|
| First-year expenditures | 333.6 | 362.6 |
| U.S. businesses acquired | 330.2 | 354.8 |
| U.S. businesses established | 1.6 | 3.6 |
| U.S. businesses expanded | 1.8 | 4.2 |
| Planned total expenditures | 345.8 | 383.8 |
| U.S. businesses acquired | 330.2 | 354.8 |
| U.S. businesses established | 2.5 | 5.2 |
| U.S. businesses expanded | 13.1 | 23.8 |
| U.S. Bureau of Economic Analysis | ||
Next release: July 2024
New Foreign Direct Investment in the United States, 2023