June 24, 2025
U.S. International Transactions, 1st Quarter 2025 and Annual Update
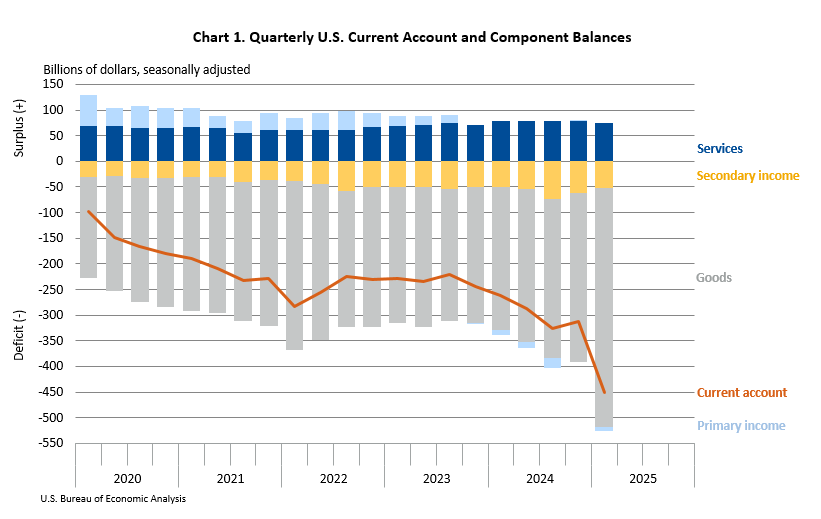
The U.S. current-account deficit widened by $138.2 billion, or 44.3 percent, to $450.2 billion in the first quarter of 2025, according to statistics released today by the U.S. Bureau of Economic Analysis. The revised fourth-quarter deficit was $312.0 billion. The first-quarter deficit was 6.0 percent of current-dollar gross domestic product, up from 4.2 percent in the fourth quarter.