Bureau of Economic Analysis
Annual Update of GDP, Industry, and State Statistics Starts Sept. 25
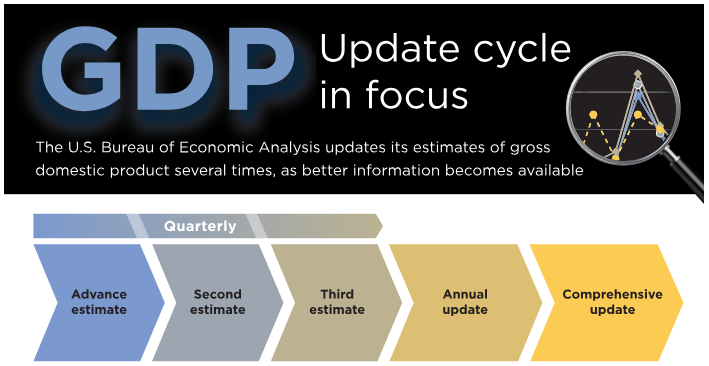
Release of the annual update of gross domestic product and related statistics, including GDP by industry, begins Sept. 25. Updates of state and county statistics start Sept. 26.
Regular annual updates enable the U.S. Bureau of Economic Analysis to refine our estimates as more complete source data become available. They are also a time to bring in improvements in methodology and presentation. This year, we'll introduce data on business investment in data centers.
Principal Federal Economic Indicators
Noteworthy
The Latest
Gross Domestic Product, 2nd quarter 2014 (second estimate); Corporate Profits, 2nd quarter 2014 (preliminary estimate)
Real gross domestic product -- the output of goods and services produced by labor and property located in the United States -- increased at an annual rate of 4.2 percent in the second quarter of 2014, according to the "second" estimate released by the Bureau of Economic Analysis. In the first quarter, real GDP decreased 2.1 percent. The GDP estimate released today is based on more complete source data than were available for the…
New Statistics on the Activities of U.S. Multinational Enterprises are Now Available
The Bureau of Economic Analysis has released preliminary 2012 statistics on the outward activities of multinational enterprises (AMNEs). Outward AMNE statistics cover the worldwide activities of U.S. multinational enterprises (MNEs). These statistics provide information on the finance and operations of U.S. MNEs, including balance sheet and income statement details, employment and employee compensation, sales, value added, capital…
Quarterly Gross Domestic Product by State, 2005–2013 (Prototype Statistics)
The quarterly GDP by state prototype statistics for 2005-2013 provide a more complete picture of economic growth across states as they evolve from quarter to quarter. The quarterly GDP by state statistics are released for 21 industry sectors and are released in both current dollars and inflation-adjusted chained (2009) dollars. Nondurable-goods manufacturing was the largest contributor to U.S. real GDP by state growth in the…
Quarterly Gross Domestic Product by State, 2005-2013 (prototype statistic)
Today, the U.S. Bureau of Economic Analysis released prototype statistics of quarterly gross domestic product (GDP) by state for 2005–2013. These new statistics provide a more complete picture of economic growth across states that can be used with other regional data to gain a better understanding of regional economies as they evolve from quarter to quarter.
U.S. Virgin Islands' Economy Shrinks for Third Consecutive Year
The estimates of Gross Domestic Product for the U.S. Virgin Islands show that real GDP, adjusted to remove price changes, decreased 5.4 percent in 2013. This was the third consecutive decline following decreases of 13.8 percent in 2012 and 7.5 percent in 2011.
Gross Domestic Product for U.S. Virgin Islands (USVI), 2013
This release is available as a PDF download.
Coming Soon: More Timely Data on the Health of States' Economies
BEA’s annual gross domestic product by state report provides a crucial look into the health of states’ economies. Soon businesses, consumers, and policymakers will get a sneak peak at a more timely and frequent version of the report.
Personal Consumption Expenditures by State Prototype Estimates for 1997-2012
Prototype estimates of personal consumption expenditures (PCE) for states for 1997-2012 provide a new tool for state-level analysis of consumer activity and household economic well-being. The PCE-by-state estimates are released for 16 expenditure categories that correspond to the national level expenditure categories published by BEA.
Personal Consumption Expenditures by State, 1997-2012 (prototype statistic)
Today, the U.S. Bureau of Economic Analysis released prototype estimates of personal consumption expenditures (PCE) for states for 1997-2012. These new estimates provide insight into household spending patterns across states that can be used together with other regional data to gain a better understanding of regional economies.
June 2014 Trade Gap is $41.5 Billion
The U.S. monthly international trade deficit decreased in June 2014 according to the U.S. Bureau of Economic Analysis and the U.S. Census Bureau. The deficit decreased from $44.7 billion in May (revised) to $41.5 billion in June as exports increased and imports decreased. The previously published May deficit was $44.4 billion. The goods deficit decreased $3.0 billion from May to $60.3 billion in June; the services surplus increased $0.1…


