Bureau of Economic Analysis
Gross Domestic Product by County and Personal Income by County, 2024
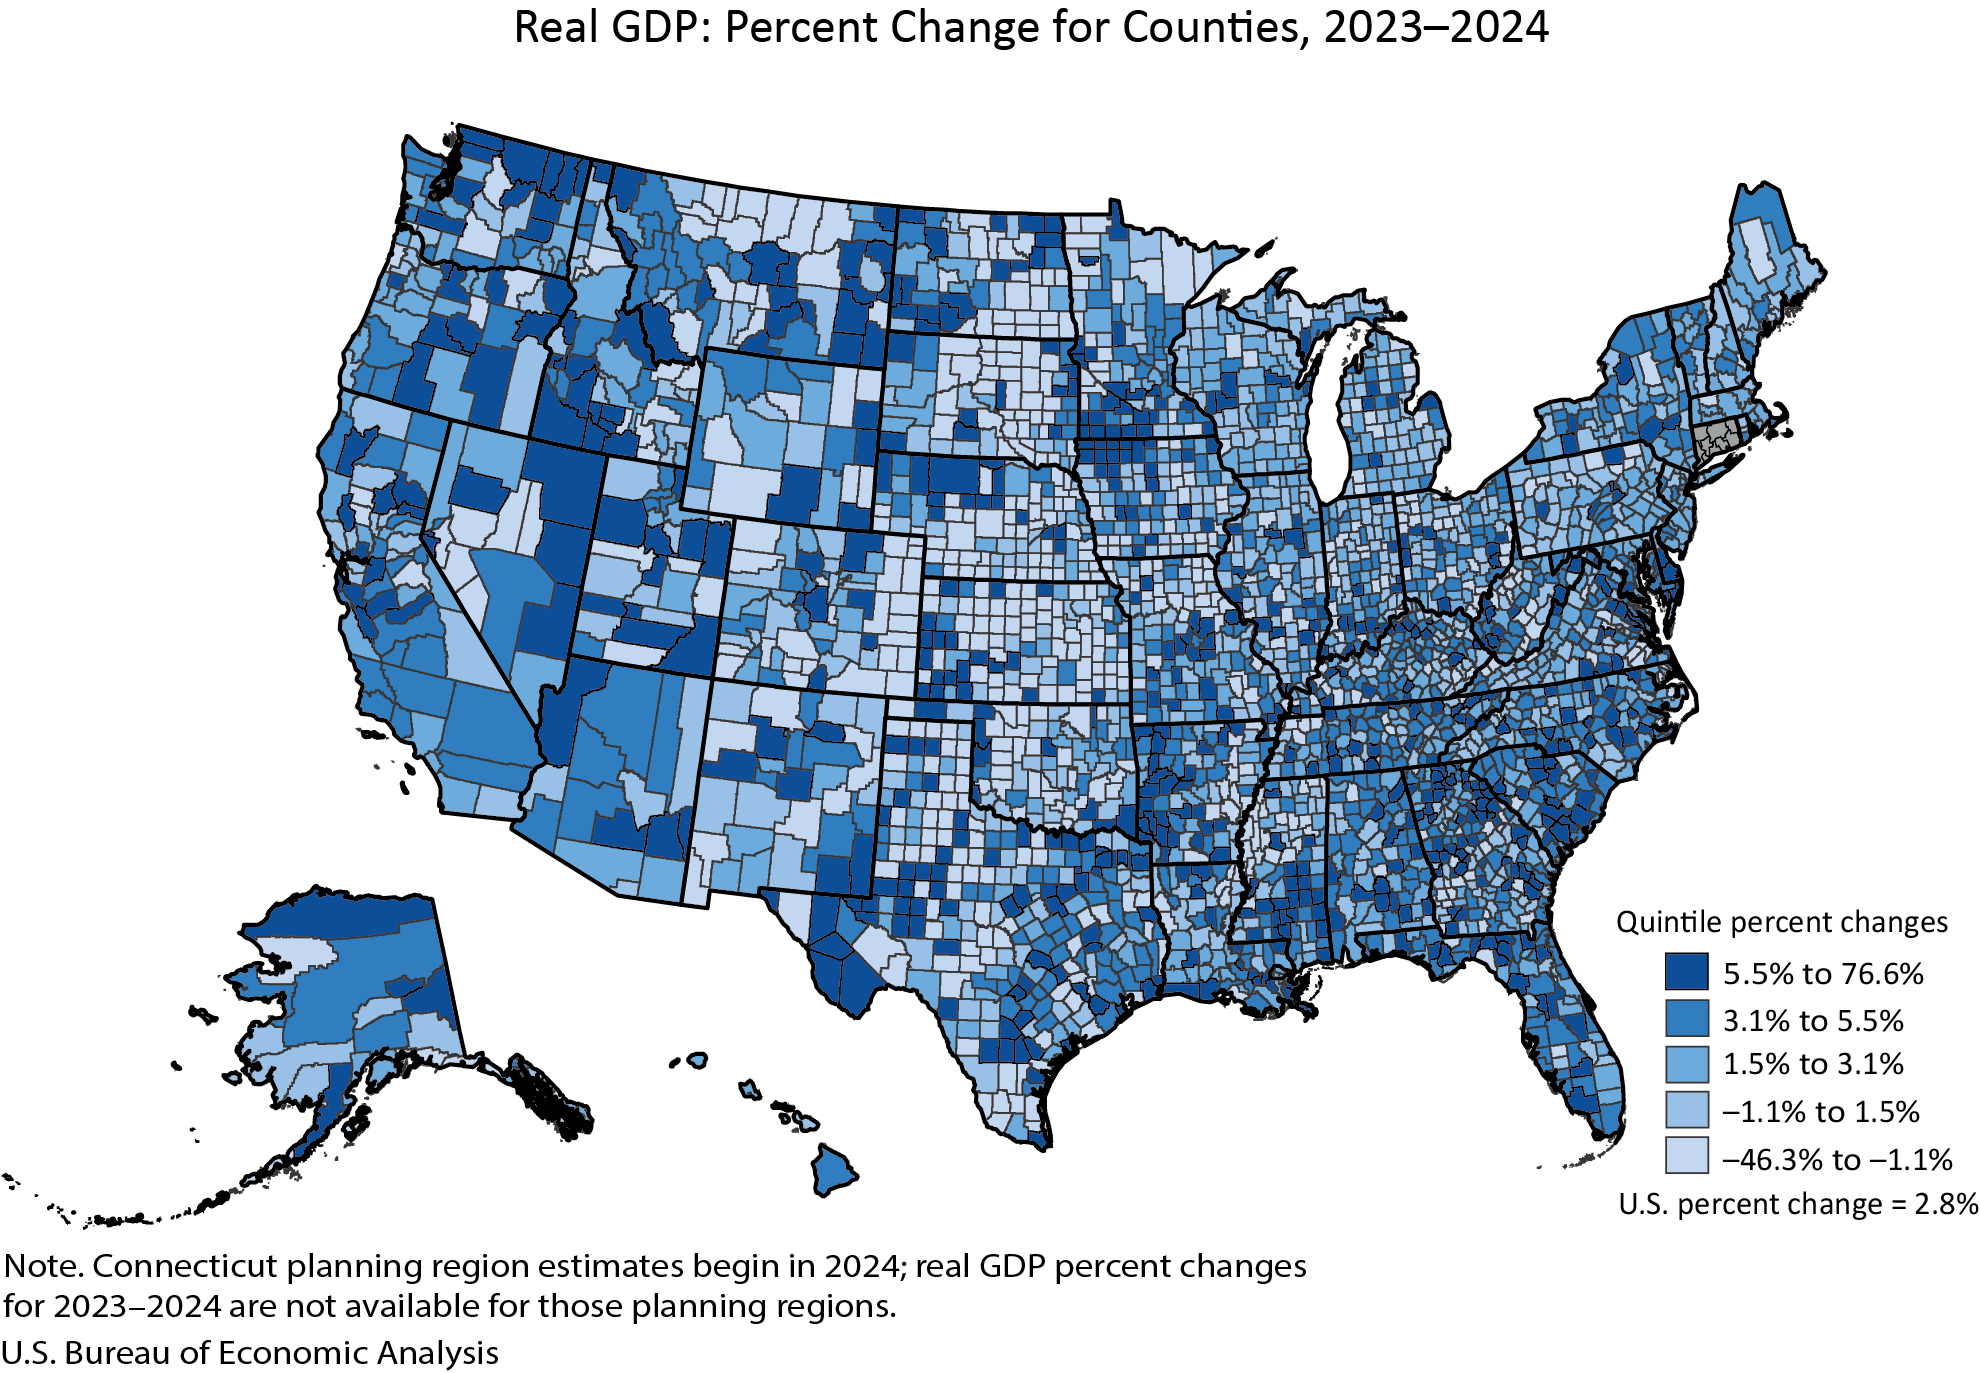
Real gross domestic product (GDP) increased in 2,273 counties, decreased in 809 counties, and was unchanged in 24 counties in 2024. County-level changes ranged from a 76.6 percent increase in Carter County, MT, to a 46.3 percent decline in Baca County, CO.
Personal income, in current dollars, increased in 2,768 counties, decreased in 331, and was unchanged in 7 counties in 2024. County-level changes ranged from a 22.6 percent increase in Harding County, SD, to a 23.3 percent decline in Issaquena County, MS.
Principal Federal Economic Indicators
Noteworthy
The Latest
Gross Domestic Product, Fourth Quarter and Year 2020
Real gross domestic product (GDP) increased at an annual rate of 4.0 percent in the fourth quarter of 2020, reflecting both the continued economic recovery from the sharp declines earlier in the year and the ongoing impact of the COVID-19 pandemic, including new restrictions and closures that took effect in some areas of the United States. In the third quarter, real GDP increased 33.4 percent. For more details, including source data, see the…
Gross Domestic Product, 4th Quarter and Year 2020 (Advance Estimate)
Real gross domestic product (GDP) increased at an annual rate of 4.0 percent in the fourth quarter of 2020, reflecting both the continued economic recovery from the sharp declines earlier in the year and the ongoing impact of the COVID-19 pandemic, including new restrictions and closures that took effect in some areas of the United States. In the third quarter, real GDP increased 33.4 percent.
Innovation at BEA: Data Projects in 2021
The Bureau of Economic Analysis continually explores the development of new statistics as part of its mission to provide Americans with a timely, accurate, and in-depth understanding of the changing U.S. economy. We’re working on innovations that are leading to expanded data in several areas.
November 2020 Trade Gap is $68.1 Billion
The U.S. monthly international trade deficit increased in November 2020 according to the U.S. Bureau of Economic Analysis and the U.S. Census Bureau. The deficit increased from $63.1 billion in October (revised) to $68.1 billion in November, as imports increased more than exports. The previously published October deficit was $63.1 billion. The goods deficit increased $5.0 billion in November to $86.4 billion. The services surplus decreased…
U.S. International Trade in Goods and Services, November 2020
The U.S. monthly international trade deficit increased in November 2020 according to the U.S. Bureau of Economic Analysis and the U.S. Census Bureau. The deficit increased from $63.1 billion in October (revised) to $68.1 billion in November as imports increased more than exports. The previously published October deficit was $63.1 billion. The goods deficit increased $5.0 billion in November to $86.4 billion. The services surplus decreased less…
U.S. International Investment Position Third Quarter 2020
The U.S. net international investment position, the difference between U.S. residents’ foreign financial assets and liabilities, was –$13.95 trillion at the end of the third quarter of 2020, according to statistics released by the U.S. Bureau of Economic Analysis (BEA). Assets totaled $29.41 trillion and liabilities were $43.36 trillion. At the end of the second quarter, the net investment position was –$13.08 trillion.
U.S. International Investment Position, Third Quarter 2020
The U.S. net international investment position, the difference between U.S. residents’ foreign financial assets and liabilities, was –$13.95 trillion at the end of the third quarter of 2020, according to statistics released by the U.S. Bureau of Economic Analysis (BEA). Assets totaled $29.41 trillion and liabilities were $43.36 trillion. At the end of the second quarter, the net investment position was –$13.08 trillion.
Gross Domestic Product by State, 3rd Quarter 2020
Real gross domestic product (GDP) increased in all 50 states and the District of Columbia in the third quarter of 2020, as real GDP for the nation increased at an annual rate of 33.4 percent. The percent change in real GDP in the third quarter ranged from 52.2 percent in Nevada to 19.2 percent in the District of Columbia.
Personal Income and Outlays, November 2020
Personal income decreased 1.1 percent while consumer spending decreased 0.4 percent in November as federal economic recovery payments and pandemic-related assistance programs continued to wind down.


