Bureau of Economic Analysis
New Foreign Direct Investment in the United States, 2024
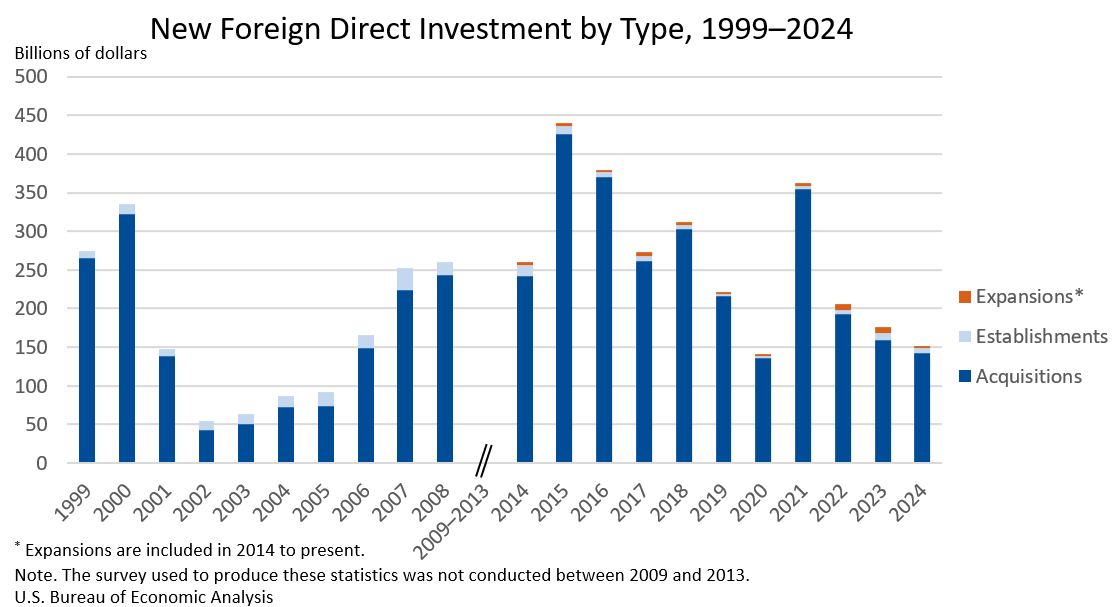
Expenditures by foreign direct investors to acquire, establish, or expand U.S. businesses totaled $151.0 billion in 2024, according to preliminary statistics released today by the U.S. Bureau of Economic Analysis. Expenditures decreased $24.9 billion, or 14.2 percent, from $176.0 billion (revised) in 2023 and were below the annual average of $277.2 billion for 2014–2023. As in previous years, acquisitions of existing U.S. businesses accounted for most of the expenditures.
Principal Federal Economic Indicators
Noteworthy
- 2025 News Release Schedule
- Innovation at BEA
- 2025 Annual Updates
- New! Services Trade Data for More Countries
- Data Tool: Trade in Value Added
- Distribution of State Personal Income
- Updated: RIMS II Regional Multipliers
- Arts and Culture
- Space Economy
- FDI Now in State BEARFACTS
- Quick Guide: Price Indexes
The Latest
Personal Income and Outlays: May 2020
Personal income decreased 4.2 percent while consumer spending increased 8.2 percent in May, according to estimates released today by the Bureau of Economic Analysis.
Gross Domestic Product, First Quarter 2020
Real gross domestic product (GDP) decreased 5.0 percent in the first quarter of 2020, according to the “third” estimate released by the Bureau of Economic Analysis. The decline is the same as in the “second” estimate released in May. In the fourth quarter of 2019, real GDP increased 2.1 percent. For more information, see the Technical Note.
Gross Domestic Product, 1st Quarter 2020 (Third Estimate); Corporate Profits, 1st Quarter 2020 (Revised Estimate)
Real gross domestic product (GDP) decreased 5.0 percent in the first quarter of 2020, according to the “third” estimate released by the Bureau of Economic Analysis. The decline is the same as in the “second” estimate released in May. In the fourth quarter of 2019, real GDP increased 2.1 percent.
Personal Income by State, 1st Quarter 2020
State personal income increased 2.3 percent at an annual rate in the first quarter of 2020, a deceleration from the 3.6 percent increase in the fourth quarter of 2019. The percent change in personal income across all states ranged from 4.9 percent in New Mexico to -0.3 percent in Michigan.
U.S. Current Account Deficit Narrows in First Quarter 2020
The U.S. current account deficit, which reflects the combined balances on trade in goods and services and income flows between U.S. residents and residents of other countries, narrowed by $0.1 billion, or 0.1 percent, to $104.2 billion in the first quarter of 2020. The narrowing mainly reflected a reduced deficit on goods that was largely offset by a reduced surplus on primary income and an expanded deficit on secondary income. The first…
More Data, Faster: BEA Rolls Out Improved International Stats
UPDATE: Prototypes previewing the structure of the upcoming trade in services tables are now available on the international services webpage. The international transaction account data tables have all been published. (Updated June 29, 2020)
U.S. International Transactions, First Quarter 2020 and Annual Update
The U.S. current account deficit narrowed by $0.1 billion, or 0.1 percent, to $104.2 billion in the first quarter of 2020, according to statistics from the U.S. Bureau of Economic Analysis. The revised fourth quarter deficit was $104.3 billion. The first quarter deficit was 1.9 percent of current dollar gross domestic product, up less than 0.1 percentage point from the fourth quarter.
April 2020 Trade Gap is $49.4 Billion
The U.S. monthly international trade deficit increased in April 2020 according to the U.S. Bureau of Economic Analysis and the U.S. Census Bureau. The deficit increased from $42.3 billion in March (revised) to $49.4 billion in April, as exports decreased more than imports. The previously published March deficit goods deficit increased $5.8 billion in April to $71.8 billion. The services surplus decreased $1.3…
U.S. International Trade in Goods and Services, Annual Revision
The U.S. monthly international trade deficit increased in April 2020 according to the U.S. Bureau of Economic Analysis and the U.S. Census Bureau. The deficit increased from $42.3 billion in March (revised) to $49.4 billion in April, as exports decreased more than imports. The previously published March deficit was $44.4 billion. The goods deficit increased $5.8 billion in April to $71.8 billion. The services surplus decreased $1.3 billion in…


