Bureau of Economic Analysis
Gross Domestic Product by County and Personal Income by County, 2024
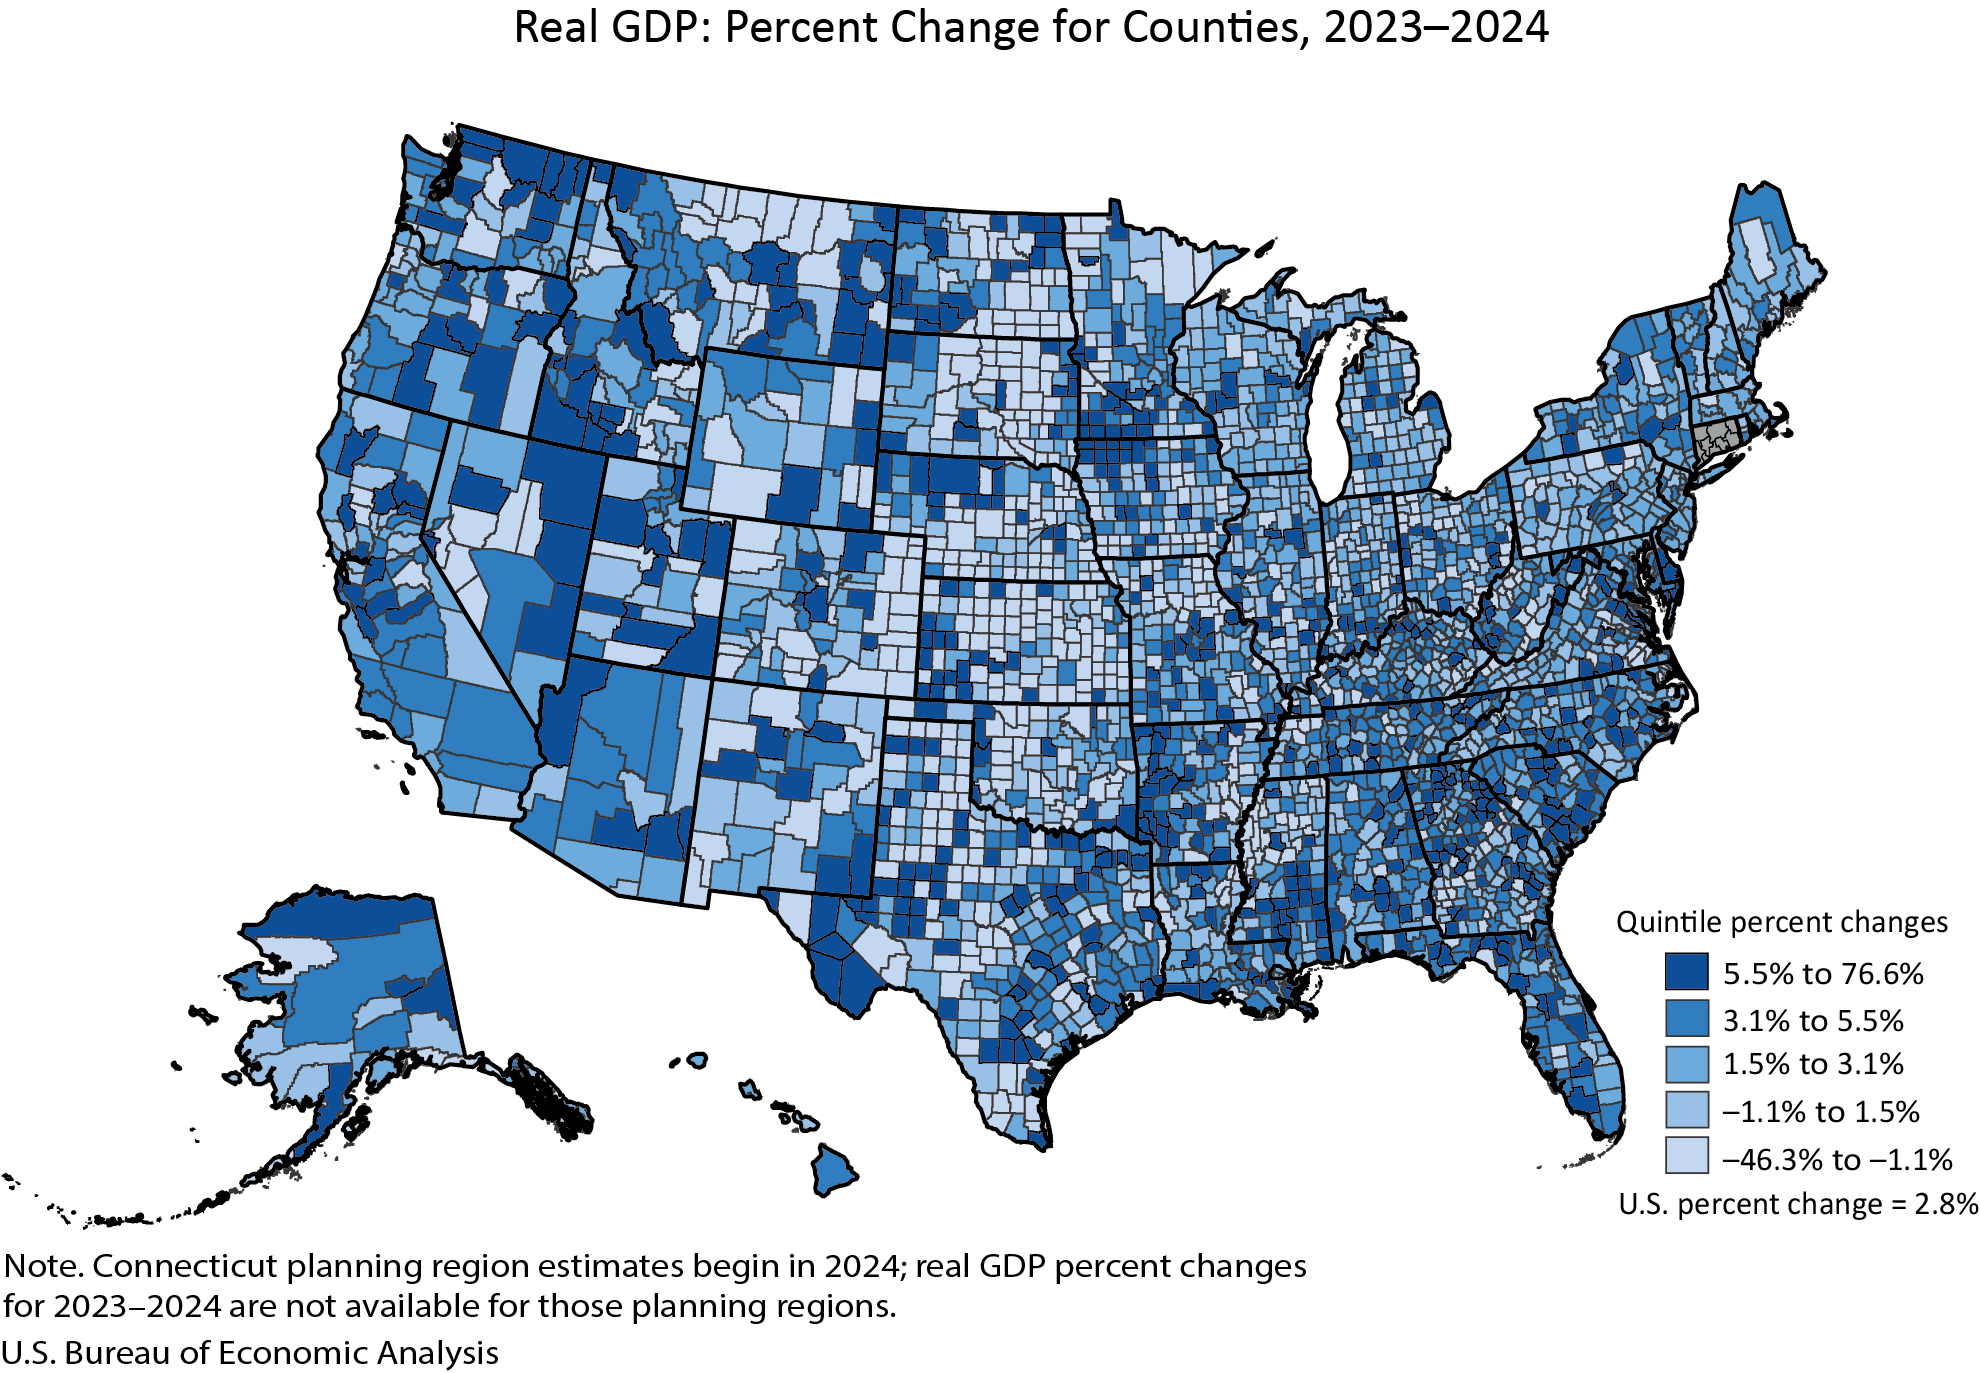
Real gross domestic product (GDP) increased in 2,273 counties, decreased in 809 counties, and was unchanged in 24 counties in 2024. County-level changes ranged from a 76.6 percent increase in Carter County, MT, to a 46.3 percent decline in Baca County, CO.
Personal income, in current dollars, increased in 2,768 counties, decreased in 331, and was unchanged in 7 counties in 2024. County-level changes ranged from a 22.6 percent increase in Harding County, SD, to a 23.3 percent decline in Issaquena County, MS.
Principal Federal Economic Indicators
Noteworthy
The Latest
Gross Domestic Product, Second Quarter 2019 (Second Estimate); Corporate Profits, Second Quarter 2019 (Preliminary Estimate)
Real gross domestic product (GDP) increased 2.0 percent in the second quarter of 2019, according to the “second” estimate released by the Bureau of Economic Analysis. The growth rate was 0.1 percentage point lower than the “advance” estimate released in July. In the first quarter, real GDP rose 3.1 percent.
American Samoa GDP Increases in 2018
The estimates of GDP for American Samoa show that real GDP—GDP adjusted to remove price changes—increased 2.2 percent in 2018 after decreasing 5.8 percent in 2017 (see Table 1.3). For comparison, real GDP for the United States (excluding the territories) increased 2.9 percent in 2018 after increasing 2.4 percent in 2017.
American Samoa GDP Increases in 2018
The Bureau of Economic Analysis released estimates of gross domestic product (GDP) for American Samoa for 2018, in addition to estimates of GDP by industry and compensation by industry for 2017. These estimates were developed under the Statistical Improvement Program funded by the Office of Insular Affairs of the U.S. Department of the Interior.
Activities of U.S. Multinational Enterprises, 2017
Worldwide employment by U.S. multinational enterprises (MNEs) increased 0.4 percent to 42.5 million workers in 2017 from 42.3 million in 2016.
Highlights of the statistics on employment by U.S. parents in 2017:
Activities of U.S. Multinational Enterprises, 2017
Worldwide employment by U.S. multinational enterprises (MNEs) increased 0.4 percent to 42.5 million workers in 2017 from 42.3 million in 2016, according to statistics released by the Bureau of Economic Analysis on the operations and finances of U.S. parent companies and their foreign affiliates.
June 2019 Trade Gap is $55.2 Billion
The U.S. monthly international trade deficit decreased in June 2019 according to the U.S. Bureau of Economic Analysis and the U.S. Census Bureau. The deficit decreased from $55.3 billion in May (revised) to $55.2 billion in June,as imports decreased more than exports. The previously published May deficit was $55.5 billion. The goods deficit decreased $0.8 billion in June to $75.1 billion. The services surplus decreased $0.6 billion in June to…
U.S. International Trade in Goods and Services, June 2019
The U.S. monthly international trade deficit decreased in June 2019 according to the U.S.Bureau of Economic Analysis and the U.S. Census Bureau. The deficit decreased from $55.3 billion in May (revised) to $55.2 billion in June, as imports decreased more than exports. The previously published May deficit was $55.5 billion. The goods deficit decreased $0.8 billion in June to $75.1 billion. The services surplus decreased $0.6 billion in June to $…
Real Disposable Income Rises in June
Personal income increased 0.4 percent in June, the same increase as in May. Wages and salaries, the largest component of personal income, increased 0.5 percent in June after increasing 0.2 percent in May.
Personal Income and Outlays: June 2019
Personal income increased 0.4 percent in June, the same increase as in May. Wages and salaries, the largest component of personal income, increased 0.5 percent in June after increasing 0.2 percent in May.
GDP Increases in Second Quarter
Real gross domestic product increased 2.1 percent in the second quarter of 2019, according to the “advance” estimate released by the Bureau of Economic Analysis. In the first quarter, real GDP increased 3.1 percent.


