Bureau of Economic Analysis
U.S. International Trade in Goods and Services, July 2025
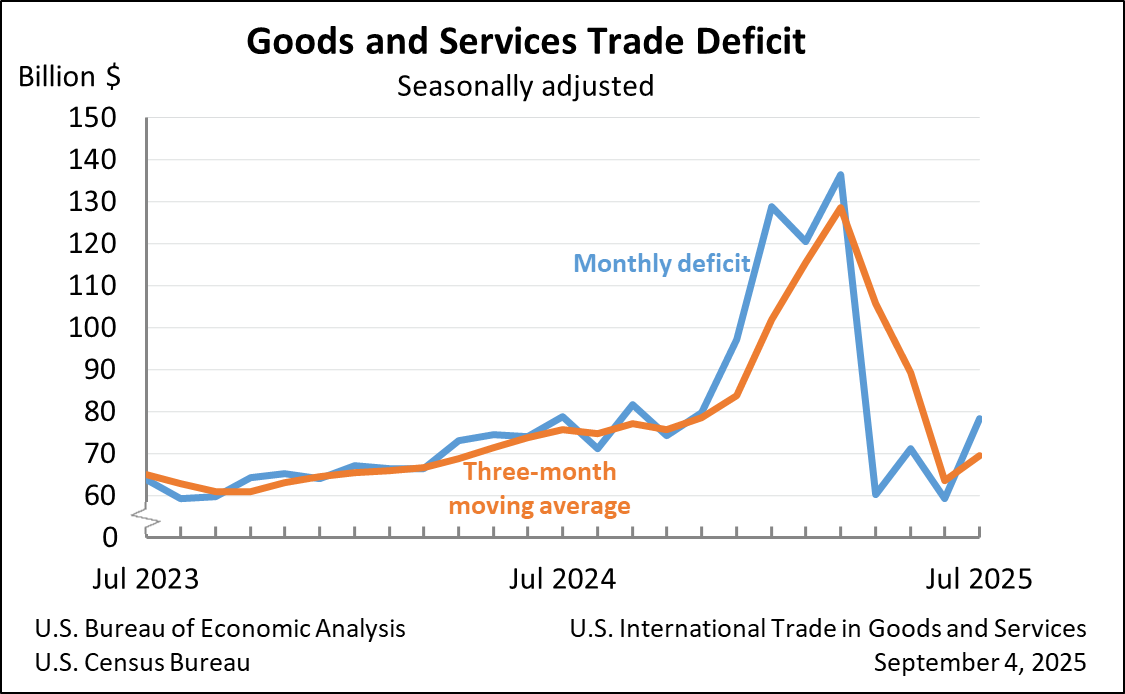
The U.S. goods and services trade deficit increased in July 2025 according to the U.S. Bureau of Economic Analysis and the U.S. Census Bureau. The deficit increased from $59.1 billion in June (revised) to $78.3 billion in July, as imports increased more than exports. The goods deficit increased $18.2 billion in July to $103.9 billion. The services surplus decreased $1.1 billion in July to $25.6 billion.
Principal Federal Economic Indicators
Noteworthy
The Latest
Gross Domestic Product, 4th quarter and annual 2018 (third estimate); Corporate Profits, 4th quarter and annual 2018
Real gross domestic product (GDP) increased 2.2 percent in the fourth quarter of 2018, according to the “third” estimate released by the Bureau of Economic Analysis. The growth rate was revised down 0.4 percentage point from the “initial” estimate released in February. In the third quarter, real GDP increased 3.4 percent.
U.S. Current-Account Deficit Increases in 2018
The U.S. current-account deficit increased to $488.5 billion (preliminary) in 2018 from $449.1 billion in 2017. As a percentage of U.S. GDP, the deficit increased to 2.4 percent from 2.3 percent.
U.S. International Transactions, 4th quarter and Year 2018
The U.S. current-account deficit increased to $134.4 billion (preliminary) in the fourth quarter of 2018 from $126.6 billion (revised) in the third quarter of 2018, according to statistics released by the Bureau of Economic Analysis (BEA). The deficit was 2.6 percent of current-dollar gross domestic product (GDP) in the fourth quarter, up from 2.5 percent in the third quarter. The previously published current-account deficit for the third…
January 2019 Trade Gap is $51.1 Billion
The U.S. monthly international trade deficit decreased in January 2019 according to the U.S. Bureau of Economic Analysis and the U.S. Census Bureau. The deficit decreased from $59.9 billion in December (revised) to $51.1 billion in January, as exports increased and imports decreased. The previously published December deficit was $59.8 billion. The goods deficit decreased $8.2 billion in January to $73.3 billion…
2018 Trade Gap is $622.1 Billion
The U.S. international trade deficit increased in 2018 according to the U.S. Bureau of Economic Analysis and the U.S. Census Bureau. The deficit increased from $552.3 billion in 2017 to $622.1 billion in 2018, as imports increased more than exports. As a percentage of U.S. gross domestic product, the goods and services deficit was 3.0 percent in 2018, up from 2.8 percent in 2017.
U.S. International Trade in Goods and Services, January 2019
The U.S. monthly international trade deficit decreased in January 2019 according to the U.S. Bureau of Economic Analysis and the U.S. Census Bureau. The deficit decreased from $59.9 billion in December (revised) to $51.1 billion in January, as exports increased and imports decreased. The previously published December deficit was $59.8 billion. The goods deficit decreased $8.2 billion in January to $73.3 billion. The services surplus increased $0…
Personal Income Grows in All States in 2018
State personal income increased 4.5 percent in 2018, after increasing 4.4 percent in 2017. In 2018, personal income increased in all states and the District of Columbia. The percent change in personal income across all states ranged from 6.8 percent in Washington to 2.9 percent in Hawaii.
State Quarterly Personal Income, 4th quarter 2018 and State Annual Personal Income, 2018 (preliminary)
State personal income increased 4.5 percent in 2018, after increasing 4.4 percent in 2017. In 2018, personal income increased in all states and the District of Columbia. The percent change in personal income across all states ranged from 6.8 percent in Washington to 2.9 percent in Hawaii.
GDP Back on Schedule With `Third’ Estimate
When the Bureau of Economic Analysis estimates the nation’s gross domestic product on March 28, it will officially be a “third estimate” – even though we’ve only estimated GDP for that quarter once before.
Arts and Culture Economy Grows 2.9 Percent in 2016
Arts and cultural economic activity grew at an inflation-adjusted 2.9 percent in 2016, increasing faster than the nation’s economy overall. For comparison, U.S. gross domestic product, or GDP, rose 1.6 percent that year.
Among state economies, Nevada posted the fastest arts and culture increase at 14.7 percent (not adjusted for inflation). Performing arts promoters and the movie industry led Nevada’s growth. The District of Columbia…


